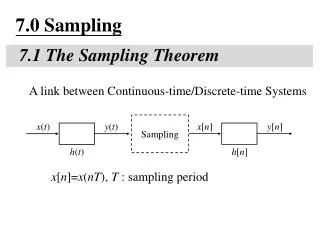
Solutions to the Sampling Activity
Solutions to the Sampling Activity. 1. a) A bingo game uses the simple random sampling method. All the numbers (total population) are put into a barrel and the required number (sample) are drawn at random. Each item has an equal chance of selection.

Solutions to the Sampling Activity
E N D
Presentation Transcript
Solutions to the Sampling Activity 1. a) A bingo game uses the simple random sampling method. All the numbers (total population) are put into a barrel and the required number (sample) are drawn at random. Each item has an equal chance of selection. b) A Canadian election is an example of non-random sampling (volunteer sampling) because each member of the population (18 years or older) can participate if they so desire. c) A census does not employ simple random sampling because every member of the target population must be included.
Solutions to the Sampling Activity 2. Given the sample size of 300 survey participants from a population of 2,700 employees • the sampling interval would be nine (2,700 ÷ 300 = 9), • the first 5 numbers of the sample would be 8, 17, 26, 35 and 44. 3. a) The overall population size would be 5, 516, 880. b) The information from Table 1 states that: • Hockey was most popular in Toronto and most unpopular in Fredericton. • Lacrosse was most popular in Victoria and most unpopular in Yellowknife. • Curling was most popular in Québec and most unpopular in Regina. • Ringette was most popular in Fredericton and most unpopular in Toronto.
Solutions to the Sampling Activity 4. a) The total student population of the Poplar Ridge Academy is 950. b) A sample of 50% of the school's student population would equal 475 students. c) 9/950 * 475 = 4.5 => means we need 5 JK boys i)The sampling method used here is stratified sampling.
Solutions to the Sampling Activity ii) The following table features the breakdown of the 180 member sample so that it is proportionate to gender by grade level:
Biases Unit 2, Day 5
By the end of the period… I can provide an example of each type of bias in data collection and analysis.
Questioning & Bias In collecting data for your final project, the truth is your goal. To avoid distorting the truth, your data-collection methods must be carefully executed to avoid bias in your research. There are many types of biases.
Bias Bias is an unintended influence on a data-gathering method.
Rick’s Rant – Polling Results • Rick’s got a few things to say about people and voting. This all relates to biases… and of course, Validity in Results! • Rick's Rant on Voting
Sampling Bias Sampling biasis when the chosen sample does not represent the population. This results from problems with either the sampling technique or the data collection method.
Non-response bias Non-response biasoccurs when particular groups are under represented because they chose not to participate (a form of sampling bias).
Response Bias Response biasoccurs when there are factors in the sampling method that influence the result such as poor question design (leading or unclear questions), or interviewer tone and attitude. Respondents may give false or misleading answers!
Measurement Bias Measurement biasoccurs when the data collection method consistently either under or over estimates a group in the population. Example: A highway engineer suggests that a way to survey traffic speeds on Hwy 85 is to have the police officers who patrol the highway record speeds of traffic around them every 30 minutes.
More measurement bias examples • The interviewers conducting a survey asking about deaths were poorly trained and included deaths which occurred before the time period of interest This would lead to an overestimate of the mortality rate because deaths which should not be included are included. • One survey team's portable machine to measure hemoglobin malfunctioned and was not checked, as should be done every day. It measured everyone's hemoglobin as 0.3 g/L too high This would lead to an underestimate of the prevalence of anemia because the readings would overestimate the hemoglobin for everyone measured by that team.
Household Bias Household biasoccurs when one type of respondent is overrepresented because groupings of different sizes were polled equally. Example: One student from each homeroom answers a survey to determine how students would feel about a trip to New York City.
Example #1 – Classify the Bias • Members of a golf and country club are polled regarding the construction of a highway interchange on part of their golf course. • A group of city councilors are asked if they have ever taken part in an illegal protest. • A survey uses a cluster random sample of Toronto residents to determine public opinion of whether the provincial government should increase funding for public transit. • Traffic volume will be estimated by counting the number of cars travelling through an intersection during the researchers lunch hour.
Example #2 – Reword to Avoid Bias • Is first year Calculus as brutal as they say? • Do you think that fighting should be eliminated from hockey so skilled players can restore the high standards of the game?
Practice Work pg 113 #1, 2, 3, 5, 6, 10