Download
1 / 65
660 likes | 930 Vues
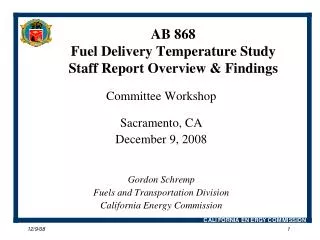
AB 868 Fuel Delivery Temperature Study Staff Report Overview & Findings. Committee Workshop Sacramento, CA December 9, 2008 Gordon Schremp Fuels and Transportation Division California Energy Commission. Presentation Topics. Overview Fuel temperature & density

E N D
AB 868 Fuel Delivery Temperature StudyStaff Report Overview & Findings Committee Workshop Sacramento, CA December 9, 2008 Gordon Schremp Fuels and Transportation Division California Energy Commission
Presentation Topics • Overview • Fuel temperature & density • Temperature compensation costs • Benefit calculations • Cost-benefit analysis results • Circumstances for Net Benefits • Permissive versus mandatory retail ATC • Other issues • Next steps
Overview - Background • Liquids expand and contract in response to changes in temperature • Petroleum industry uses a reference temperature of 60oF • Temperature of gasoline and diesel fuel delivered to retail establishments varies by geographic location and season according to an NIST study • There are “cold” & “hot” states • Temperature of retail fuel does not vary significantly prior to delivery to end consumer
Overview – Measurement Definition • Gross and net gallon units are used throughout the staff report • Gross gallons or U.S. gallons are dispensed at retail stations – 231 cubic inches per gross gallon, regardless of fuel temperature • Net gallons or petroleum gallons are transacted at wholesale distribution terminals – 231 cubic inches at 60 degrees Fahrenheit only • Net gallons that are warmer than the 60 degree Fahrenheit reference standard would be larger than 231 cubic inches • Conversely, fuel temperatures below the reference standard would yield net gallons smaller than 231 cubic inches
Overview - Measurement Change • A change from U.S. gross gallons to net gallons at retail stations in California would not be similar to a conversion to the metric system • Because the cubic inches dispensed to retail motorists would vary according to temperature. • The number of cubic inches dispensed to retail motorists if stations converted to liters would be fixed under varying temperature
Overview – Temperature CompensationPractices Vary – Wholesale & Retail • The application of temperature compensation at wholesale and retail are not the same • Wholesale terminal temperature compensation involves the calculation of net gallons to determine final cost of the tanker truck load of fuel – price adjustment • Retail station automatic temperature compensation (ATC), if mandated, would involve the distribution of net gallons to consumers that are variable in size as measured in cubic inches – volume adjustment
Overview – Existing Programs • Hawaii – mid 1970s • New reference temperature of 80 degrees Fahrenheit at retail stations • Slightly larger sized “gallon” dispensed at retail • 233.8 cubic inches, rather than 231 cubic inches • Canada – early 1990s • Established voluntary ATC regulations at retail stations • Over 90 percent of stations have made conversion • Fuel temperatures are colder than the reference standard • Belgium - 2008 • ATC being phased in at retail stations
Overview - AB 868 Objectives • Determine if temperature compensation makes economic sense for retail application in California • Legislation requires that we examine two different approaches to temperature compensation • ATC equipment at retail • New reference temperature • Each primary option will require the quantification and comparison of benefits to costs • Primary focus: Will the costs outweigh the benefits? • Final report to Legislature will have recommendations
Temperature Study • The California Division of Measurement Standards (DMS) worked with county sealers to obtain fuel temperature data at retail establishments beginning April of 2007 • Temperature survey work continued through March of 2008 http://www.cdfa.ca.gov/dms/fueltempsurvey/FuelTempReports.pdf • DMS has provided Energy Commission staff with the data set • Majority of counties have temperature data • 85 percent of taxable gasoline sales represented • 78 percent of taxable diesel fuel sales represented
Temperature Study - Overview • County sealers sampled temperatures during their routine station inspections • Air temperature • Fuel in storage tank • Fuel dispensed from the nozzle – prover temperature • Temperatures data was only collected for up to 20 percent of the visits • No temperature data for mid-grade gasoline • Gasoline is assumed to contain approximately 6 percent ethanol by volume
Temperature Survey – Sample Points Source: NCWM graphic amended by CEC staff.
California Fuel Temperatures Source: CEC staff analysis of DMS Temperature Survey information.
Temperature Study – Gasoline Results • Gasoline results – regular grade • 71.1 degrees F - statewide weighted average • August was highest month – 82.0 degrees F • January was lowest month – 59.7 degrees F • Highest county arithmetic average • 89.6 degrees F during July in Riverside county • Highest recorded temperature • 102.0 degrees F during July in Tulare county • Lowest county arithmetic average • 50.5 degrees F during January in Butte county • Lowest recorded temperature • 43.0 degrees F during January in Amador county
Temperature Study – Diesel Results • Diesel fuel results • 72.9 degrees F - statewide weighted average • August was highest month – 84.6 degrees F • December was lowest month – 60.4 degrees F • Highest county arithmetic average • 92.0 degrees F during August in Fresno county • Highest recorded temperature • 106.7 degrees F during July in Riverside county • Lowest county arithmetic average • 51.8 degrees F during January in Butte county • Lowest recorded temperature • 50.6 degrees F during January in Butte county
Temperature Study – Estimated Values • Energy Commission staff determined that there is a statistically strong relationship between ambient temperatures and fuel temperatures • Average ambient temperatures can explain between 76 and 87 percent of the fuel prover (dispenser) temperatures throughout the year • This mathematical relationship was used to estimate fuel temperatures for the counties and months that did not have results from the initial survey • Represented 15 percent of the State’s gasoline demand • 22 percent of the diesel fuel demand
Temperature Variation – Tank to Nozzle • Fuel temperatures can vary between the underground storage tanks (USTs) and the fuel dispenser (prover) – by as much as 15 to 20 degrees Fahrenheit • But most of the time these differences are quite small • Regular grade gasoline • 70 percent of the time the differences are within + or – 3 degrees Fahrenheit • 95 percent of the time the differences are within + or – 7 degrees Fahrenheit • “Prover” is the container used by the county sealer inspector to measure volume of fuel dispensed from the retail nozzle
Regular Grade Gasoline – UST vs. Prover Source: CEC staff analysis of DMS Temperature Survey information.
Temperature Variation – Diesel Fuel • Diesel fuel temperature differences – UST vs. prover • 55 percent of the time the differences are within + or – 3 degrees Fahrenheit • 85 percent of the time the differences are within + or – 7 degrees Fahrenheit • Variation of differences a little greater for diesel fuel compared to gasoline
Diesel Fuel – UST vs. Prover Source: CEC staff analysis of DMS Temperature Survey information.
Fuel Density • The density of the transportation fuel is a factor used to calculate how much gasoline or diesel fuel would expand or contract due to changing temperatures • Density of gasoline and diesel fuel varies due to differences in crude oil, refining processing, and seasonal specifications (for gasoline) • If ATC is mandated at California retail stations, a single density value for each fuel type may be less precise but more feasible approach • Altering the density value on a seasonal or per-delivery basis would be costly, problematic, and only decrease the potential error by an almost imperceptible measure
Gasoline Density Variations • The Canadian standard density value for gasoline is at the lower range of both the California and U.S. density values for the summer period of 2006 Source: CEC staff analysis of AAM and PIIRA information.
Diesel Density Variations • The Canadian standard density value for diesel fuel of is nearly midway between the average California and U.S. results for the summer of 2006 Source: CEC staff analysis of AAM and PIIRA information.
Alternative Fuel Densities • California use of ethanol and biodiesel expected to grow • If ATC is mandated at California retail stations, blends of gasoline and diesel fuel with low concentrations should not pose a density concern • But E85 (85 percent ethanol and 15 percent gasoline) should have a density designation that differs from the gasoline value • Blends of B100 (100 percent biodiesel) should also have a separate density value assigned other than the one for diesel fuel • Otherwise, increased use of alternative fuels not expected to pose a problem for temperature compensation
Temperature Compensation - Initial Costs • Initial year costs for temperature compensation are highest for the ATC Retrofit option, ranging between $102 million and $123 million • Equipment $84.2 million or $8,682 per retail station • Installation labor $8.8 to $26 million (with inspection fee) • Financing $9.5 to $12.9 million • Total initial cost of $10,570 to $12,694 per retail station or • Five tenths (5/10) to seven tenths (7/10) of a cent per gallon • Initial year costs for the Reference Temperature option are much lower, estimated to range between $7.8 million and $24.1 million • Labor to adjust dispensers $804 to $2,483 per retail station
ATC Retrofit - Kit Costs • About 70 percent of the retail stations in California blend midgrade gasoline at the fuel dispenser • Approximately 11 percent of the retail outlets have at least one mechanical fuel dispenser
ATC Retrofit - Labor Costs • Labor costs include labor rates that include all benefits and overhead – fully loaded rates between $60 and $70 per hour • Staff assumed two technicians and between 1.5 and 4 hours of labor per fuel dispenser • Total statewide labor costs amount to between $7.8 and $24.1 million or from $804 to $2,483 per retail station • Rural stations and locations more distant from urban areas include travel expenses – additional $290,000 to $725,000
ATC Retrofit – Financing Costs • Cost to pay for the ATC retrofit equipment (including installation) assumed to be accomplished through the use of business loans • Financing costs include interest and loan fees • Interest rates ranged between 4 and 9.5 percent • Loan fees (points and other expenses) assumed to be 2 percent of loan value • Total statewide financing costs amount to between $9.5 and $12.9 million or from $984 to $1,329 per retail station • Low estimate assumes costs recovered over three years • High estimate assumes costs recovered over one year
Temperature CompensationRecurring Costs • There are no recurring costs expected under the Reference Temperature option • Recurring costs for the ATC Retrofit option, range between $4.4 million and $13.5 million per year • Inspection fees $1.0 to $1.9 million • New dispenser higher costs $0.9 to $1.0 million • ATC maintenance $2.6 to $10.6 million • On a per-station basis: $458 to $1,395 per year • Or between two hundredths (2/100) and seven hundredths (7/100) of a cent per gallon
ATC Retrofit Recurring CostsIncreased Inspection Fees • If ATC is mandated for California retail stations, the time required to inspect and certify fuel dispensers would increase • Staff estimates inspection time will require between 10 and 20 percent more time • Increased time could translate to an additional $100 to $200 per year for retail station owners • Annual inspection fee currently limited to $1,000 – this cap may have to be increased to at least $1,200 to help ensure that all county sealers would be able to recover their incremental costs
ATC Retrofit Recurring CostsMore Expensive Fuel Dispensers • If ATC is mandated for California retail stations, fuel dispenser costs could increase due to the use of additional ATC components in all new dispensers • Roughly 500 to 550 new dispensers per year • Staff assumes incremental costs would be similar to expense of ATC retrofit kits, less the labor in the field • Statewide cost of between $0.9 and $1.0 million per year
ATC Retrofit Recurring CostsMaintenance – Low Estimate • If ATC is mandated for California retail stations, the equipment would likely require some level of servicing and replacement prior to the natural lifetime of the dispenser • Low estimate assumes 10 percent of retail stations require a service technician to spend 8 hours and replace 25 percent of the initial ATC component cost • $60 per hour fully-loaded wage rate • About $2.6 million per year for the entire state • This level of maintenance implies an ATC-related equipment failure rate of 2.5 percent per year
ATC Retrofit Recurring CostsMaintenance – High Estimate • High estimate assumes 20 percent of retail stations require a service technician to spend 16 hours and replace 50 percent of the initial ATC component cost • $70 per hour fully-loaded wage rate • About $10.6 million per year for the entire state • This level of maintenance implies an ATC-related equipment failure rate of 10 percent per year
ATC Retrofit Option - Cost Summary • Initial year cost – five tenths (5/10) to seven tenths (7/10) of a cent per gallon, recurring costs two hundredths (2/100) to seven hundredths (7/100) of a cent per gallon
Agency Costs • If ATC is mandated for use at retail stations in California the Division of Measurement Standards (DMS) would need to craft new regulations - should not require additional funding or positions • Evaluation of ATC retrofit kits, as well as ATC-capable fuel dispensers is a program for which applicants are charged fees designed to cover related expenses incurred by DMS • This portion of ATC-related activity would be “self- funding,” as those fees are paid by the manufacturers of the devices
Recovery of Expenses • Most retail station owners in California operate in a highly competitive business environment that can, at times, create temporary difficulties and challenges with regard to recovering increased expenses • Retail stations that sell fuel and non-fuel commodities (such as convenience stores) have increased flexibility to attempt incremental expense recovery by increasing prices for multiple goods (gasoline and foodstuffs) and/or services (car washes)
Potential Impacts on Fuel Availabilityfor Isolated Locations • If ATC is mandated at retail stations in California, it is possible that the expense to comply with the regulation could be onerous for some station owners • Closure of a retail stations in an urban areas usually does not create a fuel availability problem for consumers • But the closure of a community’s sole retail station could create a fuel supply problem • If ATC is required in California, there should be provisions put in place to ensure that retail stations that serve isolated California communities should receive special consideration for financial assistance
Potential Impacts on Fuel Availabilityfor Isolated Locations • Staff has conducted a preliminary estimate that there would be no more than 450 locations that might be at risk • Initial estimate has been further revised to a figure of no more than 200 retail stations • If ATC is mandated at California retail stations, a fund could be created to finance the retrofit of these “at-risk” locations • Sufficient monies could be generated by applying a temporary fee on all gasoline and diesel fuels of between two hundredths (2/100) and three hundredths (3/100) of a cent per gallon for six months
Potential Consumer Benefits • Potential consumer benefits were quantified in two categories • Portion of the expected benefits of purchasing fewer retail “units” that would be retained by retail motorists • Benefit of increased price transparency – information asymmetry • The annual consumer benefits would be used to compare to the annual industry costs to determine if the cost-benefit analysis (CBA) would be positive (net benefit) or negative (net cost) for society • “Society” in this context are the retail stations and the consumers who purchase fuel from those locations
Expected Benefits of Less Units • If ATC is mandated at California retail stations, the average size of the “gallon” purchased by retail motorists would be larger in size as measured in terms of cubic inches – roughly 232.7 compared to the standard of 231.0 for U.S. gross gallons • Consumers would receive a slightly larger, but variable size, retail net gallon • This change in retail distribution from gross to net gallons would have resulted in fewer units purchased by California retail motorists – but the identical overall quantity as measured in cubic inches
Expected Benefits of Less Units • The change in units sold at retail stations over the study period (April 2007 through March 2008) would have amounted to about 136 million less “gallons” • 117 million gallons of gasoline • 19 million gallons of diesel fuel • The value of these fewer units not purchased by consumers is estimated at about $438 million during the study period • $376.4 million for gasoline • $91 million for diesel fuel
Expected Benefits of Less Units • Potential benefits to retail motorists the portion of this revenue that is retained by consumers and not successfully recaptured by retail station owners over the long term through raising the price of fuel and non-fuel commodities that they sell to consumers to avoid a loss of $438 million in revenue • Staff believes that retail station owners over time will attempt to recover this revenue shift during warmer months by either raising fuel prices, non-fuel commodity prices, or a combination of the two strategies
Expected Benefits of Less Units • But revenue recapture will be neither precise nor consistent, because station operators will not monitor temperature continuously and adjust retail prices accordingly to compensate absent any other competitive factors • However, staff believes that the retail station owners, in aggregate, will be successful in recovering this revenue shift over the long term assuming the industry remains as profitable as it has been over the last several years • Therefore, expected benefits retained by retail motorists as a consequence of purchasing fewer, but on average larger, variable units will be zero
Information Asymmetry Benefit • Another category of potential retail motorist benefits is referred to as increased price transparency or the elimination of information asymmetry • Having no knowledge of fuel temperature at the time of a transaction creates a problem in that retail fuel consumers cannot adequately compare the benefits or value of fuel prices advertised by two competing retail stations • By improving the retail price transparency for motorists, the deadweight loss or inefficiency in the marketplace is corrected resulting in a monetary benefit for consumers, albeit quite small
Information Asymmetry Benefit • Staff has calculated this value to be approximately $3.2 million per year • If ATC is mandated for use at California retail stations, this value would be a recurring economic benefit for California retail motorists • When the value is expressed in terms of fuel gallons, the annual consumer benefit for eliminating deadweight loss associated with temperature variations equates to approximately 17 thousandths (17/1000) of a cent per gallon • The CBA results are a comparison of the estimated costs and benefits over time
ATC Retrofit OptionCBA Results – Low Estimate • Recurring net cost of six thousandths (6/1000) of a cent per gallon on a recurring basis – low estimate
ATC Retrofit OptionCBA Results – High Estimate • Recurring net cost of six hundredths (6/100) of a cent per gallon on a recurring basis – high estimate
Reference Temperature OptionCBA Results • If the statewide reference temperature option is mandated for use at California retail stations, the initial year CBA results are calculated to have a net cost of between four hundredths (4/100) and 13 hundredths (13/100) of a cent per gallon • CBA results for the recurring years are expected to have a zero net cost/benefit • There would be essentially no increased price transparency retail motorist benefits since variability of retail fuel temperatures has not been corrected under this option