Download
1 / 24
300 likes | 602 Vues
UC Santa Cruz Satellite Remote Sensing Workshop December 8 th 2009. A Brief Overview of Trace Gas Remote Sensing Principles and OMI Capabilities. Jun Wang Univ. of Nebraska – Lincoln. Gas Absorption. Absorption.

E N D
UC Santa Cruz Satellite Remote Sensing Workshop December 8th 2009 A Brief Overview of Trace Gas Remote Sensing Principles and OMI Capabilities Jun Wang Univ. of Nebraska – Lincoln
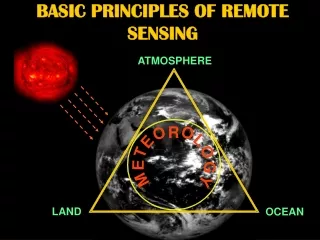
Gas Absorption Absorption Unlike remote sensing of aerosols that use the signature of aerosol scattering, remote sensing of trace gases uses the signature of gas absorption.
Gas Absorption Line photon Absorption - - + + Emission Ground state photon Excited state Changes in internal energy are always associated with emission/absorption of photons, and have to be quantized. Planck’s constant frequency
Broadening of Absorption Line There are several mechanisms which cause a broadening of the absorption line. Most common in the troposphere is the pressure broadening due to collisions that randomly disrupt natural transitions between energy states. Collision
Trace Gases Absorption Spectrum in UV and Visible Each trace gas has its own unique absorption spectra.
Retrieval of the vertical profile of trace gases The characteristics of absorption spectra of trace gases most of the time will also depend on pressure/temperature or altitude. X. Liu, GEST/UMBC Wavelength-dependent O3 absorption provides discrimination of O3 at different altitudes
Ozone Monitoring Instrument (OMI) • Launched on July 15, 2004 on the NASA EOS Aura Satellite • Nadir-viewing UV/Visible • 270-310 nm @ 0.6 nm • 310-500 nm @ 0.45 nm • 1:40 PM equatorial crossing time • 13x24 km2 at nadir • Daily global coverage. Air Quality Products: Column O3 (stratosphere + troposphere) Tropospheric O3 (experimental) Aerosol optical depth (in UV) Column NO2 Column SO2 Column HOCO …
Spectra of OMI Trace Gas Products HCHO absorption spectrum (Formaldehyde) NO2 absorption spectrum Ozone absorption spectrum SO2 absorption spectrum 420-450nm 316-340nm 324-348nm 305-330nm 2 1 1 1 1 2 2 2
Unit for measuring COLUMN burden of gases # molecules / area For O3, the most common unit of measurement is the “Dobson Unit” that describes how much ozone there would be in the column if it were all squeezed into a single layer at STP (273.15 K and 1.01325 X 10⁵ Pa) 1 “Dobson Unit (DU)” = 0.01 mm ozone at STP (273.15 K and 105 Pa) = 2.69x10¹⁶ molecules cm-2 G. M. B. Dobson 1889 - 1976
Notice that none of the air quality standards for trace gasses are in Dobson Units! The science of using Remote Sensing instruments for air quality work is still in its infancy. A very hot topic of research is “How do we relate total column measurements to ground level values and exposure?”
GOOD AND BAD OZONE Good (UV shield) Bad (greenhouse gas) Good (OH source) Bad (smog) Slide courtesy: D. Jacob, Harvard NOx = NO + NO2: nitrogen oxide radicals VOC (volatile organic compounds) = light hydrocarbons and substituted organic compounds
OMI column O3 Method: UV solar backscatter 1 2 Approximately 90% of the Ozone is in the stratosphere. Therefore a measure of total column ozone is of limited usefulness for air quality applications. Ozone layer Scattering by Earth surface and atmosphere Ozone absorption spectrum 316-340nm 1 2
OMI Tropospheric O3 Column an experimental product X. Liu, GEST/UMBC
GOME Tropospheric O3 Oct. 22-24, 1997 Image courtesy: Xiong Liu, UMBC & NASA
NOx = NO2 + NO • NOx + VOC O3 + … • precursor of nitrate acid (causes acid rain) • nitrate acid + ammonia nitrate particle particulate pollution • toxic • primarily from vehicle exhaust and other combustion • most NOX is NO2.
Tropospheric NO2 Measurements from Space NO2 absorption spectrum 420-450nm October 2004 1 2 Boersma et al. [JGR 2008]
Exercises go to http://www.temis.nl/airpollution find NO2 in southeast Asia and Indonesia 2004
HCHO (Formaldehyde) • a type of VOC, and precursor of tropospheric CO and O3 • also an intermediate product of oxidation of many other VOCs HCHO absorption spectrum 324-348nm 1 2
SO2 • a precursor of sulfate acid (acid rain) and sulfate particle • colorless gas with a suffocating, choking odor. • toxic to humans • primary from burning of coals (smelters, power plants) • sometime from volcanic eruptions
Average OMI SO2 burdens over eastern USA - major power plants SO2 absorption spectrum 305-330nm Image courtesy: Nickolay Krotkov, UMBC & NASA 1 2
OMI SO2 burdens over India Image courtesy: Nickolay Krotkov, UMBC & NASA
Exploration Go to http://so2.umbc.edu/omi Click “special case OMI images” Click movie for Rabaul eruptions on Oct 7, 2006 Click “Daily OMI Images” on the left Select region and date of your interest Follow the NOAA link for near real time images or go directly to: http://satepsanone.nesdis.noaa.gov/pub/OMI/OMISO2/index.html Select region and date of your interest.
Giovanni Scavenger Hunt Try to find the following (only two tries allowed for each item) • A region of the U.S. (no larger than ¼ of the country) with the highest 2 week average period of NO2. 2. A region of the globe no larger than than 10 x 10 degrees with the highest single day value for SO2. Hints: Look at all of the visualization types available through Giovanni to help you.