Molecular Phylogeny
Molecular Phylogeny. Biology 224 Instructor: Tom Peavy Nov 3, 8 & 10. <Images adapted from Bioinformatics and Functional Genomics by Jonathan Pevsner> . Introduction. Charles Darwin’s theory of evolution. --struggle for existence induces a natural selection.

Molecular Phylogeny
E N D
Presentation Transcript
Molecular Phylogeny Biology 224 Instructor: Tom Peavy Nov 3, 8 & 10 <Images adapted from Bioinformatics and Functional Genomics by Jonathan Pevsner>
Introduction Charles Darwin’s theory of evolution. --struggle for existence induces a natural selection. --Offspring are dissimilar from their parents (that is, variability exists), and individuals that are more fit for a given environment are selected for. --over long periods of time, species evolve. --Groups of organisms change over time so that descendants differ structurally and functionally from their ancestors.
The basic processes of evolution are [1] mutation, [2] genetic recombination [3] chromosomal organization (and its variation); [4] natural selection [5] reproductive isolation, which constrains the effects of selection on populations
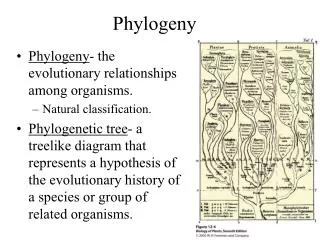
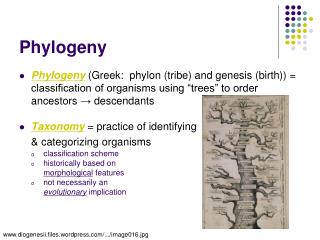
At the molecular level, evolution is a process of mutation with selection. Molecular evolution is the study of changes in genes and proteins throughout different branches of the tree of life. Phylogeny is the inference of evolutionary relationships. Traditionally, phylogeny relied on the comparison of morphological features between organisms. Today, molecular sequence data are also used for phylogenetic analyses.
Goals of molecular phylogeny Phylogeny can answer questions such as: • How many genes are related to my favorite gene? • (gene tree) • Are humans more closely related to chimps or gorillas? • (species tree) • How related are whales, dolphins & porpoises to cows? • Where and when did HIV originate? • What is the history of life on earth?
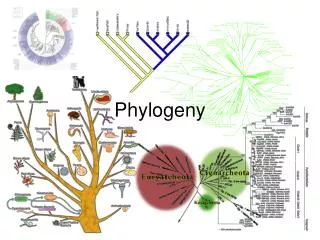
The Structure of Phylogenetic Trees
2 A F 1 1 G B 2 I H 2 C 1 D 6 E time Molecular phylogeny uses trees to depict evolutionary relationships among organisms. These trees are based upon DNA and protein sequence data. A 2 1 1 B 2 C 2 2 1 D 6 one unit E
2 A F 1 1 G B 2 I H 2 C 1 D 6 E time Tree nomenclature Branches are unscaled... Branches are scaled... A 2 1 1 B 2 C 2 2 1 D 6 one unit E …OTUs are neatly aligned, and nodes reflect time …branch lengths are proportional to number of amino acid changes
2 A F 1 1 G B 2 I H 2 C 1 D 6 E time Tree nomenclature operational taxonomic unit (OTU) such as a protein sequence taxon A 2 1 1 B 2 C 2 2 1 D 6 one unit E
2 A F 1 1 G B 2 I H 2 C 1 D 6 E time Tree nomenclature Node (intersection or terminating point of two or more branches) branch (edge) A 2 1 1 B 2 C 2 2 1 D 6 one unit E
2 A F 1 1 G B 2 I H 2 C 1 D 6 E time Tree nomenclature bifurcating internal node multifurcating internal node A 2 1 B 2 C 2 2 1 D 6 one unit E
Tree nomenclature: clades Clade ABF (monophyletic group) A 2 F 1 1 B G 2 I H 2 C 1 D 6 E time
Tree nomenclature Clade ABF/CDH/G 2 A F 1 1 G B 2 I H 2 C 1 D 6 E time
Tree roots The root of a phylogenetic tree represents the common ancestor of the sequences. Some trees are unrooted, and thus do not specify the common ancestor. A tree can be rooted using an outgroup (that is, a taxon known to be distantly related from all other OTUs).
Tree nomenclature: roots past 9 1 5 7 8 6 7 8 2 3 present 4 2 6 4 5 3 1 Rooted tree (specifies evolutionary path) Unrooted tree
Tree nomenclature: outgroup rooting past root 9 10 7 8 7 9 6 8 2 3 2 3 4 present 4 6 Outgroup (used to place the root) 5 1 5 1 Rooted tree
Numbers of trees Number Number of Number of of OTUs rooted trees unrooted trees 2 1 1 3 3 1 4 15 3 5 105 15 10 34,459,425 105
Species trees versus gene/protein trees Molecular evolutionary studies can be complicated by the fact that both species and genes evolve. speciation usually occurs when a species becomes reproductively isolated. In a species tree, each internal node represents a speciation event. Genes (and proteins) may duplicate or otherwise evolve before or after any given speciation event. The topology of a gene (or protein) based tree may differ from the topology of a species tree.
Species trees versus gene/protein trees past speciation event present species 2 species 1
Species trees versus gene/protein trees Gene duplication events speciation event OTUs species 2 species 1
Historical background: insulin By the 1950s, it became clear that amino acid substitutions occur nonrandomly e.g. most amino acid changes in the insulin A chain are restricted to a disulfide loop region. Such differences are called “neutral” changes rate of nucleotide (and of amino acid) substitution is about six- to ten-fold higher in the C peptide, relative to the A and B chains.
Mature insulin consists of an A chain and B chain heterodimer connected by disulphide bridges The signal peptide and C peptide are cleaved, and their sequences display fewer functional constraints.
0.1 x 10⁻⁹ 1 x 10⁻⁹ 0.1 x 10⁻⁹ Number of nucleotide substitutions/site/year for insulin
Historical background: insulin Surprisingly, insulin from the guinea pig (and from the related coypu) evolve seven times faster than insulin from other species. Why? The answer is that guinea pig and coypu insulin do not bind two zinc ions, while insulin molecules from most other species do. There was a relaxation on the structural constraints of these molecules, and so the genes diverged rapidly.
Molecular clock hypothesis In the 1960s, sequence data were accumulated for small, abundant proteins such as globins, cytochromes c, and fibrinopeptides. Some proteins appeared to evolve slowly, while others evolved rapidly. Linus Pauling, Emanuel Margoliash and others proposed the hypothesis of a molecular clock: For every given protein, the rate of molecular evolution is approximately constant in all evolutionary lineages
Molecular clock hypothesis Richard Dickerson (1971) plotted data from three protein families: cytochrome c, hemoglobin, and fibrinopeptides. The x-axis shows the divergence times of the species, estimated from paleontological data. The y-axis shows m, the corrected number of amino acid changes per 100 residues. n is the observed number of amino acid changes per 100 residues, and it is corrected to m to account for changes that occur but are not observed. N 100 = 1 – e-(m/100)
Dickerson (1971) corrected amino acid changes per 100 residues (m) Millions of years since divergence
For each protein, the data lie on a straight line. Thus, • the rate of amino acid substitution has remained • constant for each protein. • The average rate of change differs for each protein. • The time for a 1% change to occur between two lines • of evolution is 20 MY (cytochrome c), 5.8 MY • (hemoglobin), and 1.1 MY (fibrinopeptides). • The observed variations in rate of change reflect • functional constraints imposed by natural selection.
Molecular clock for proteins: rate of substitutions per aa site per 109 years Fibrinopeptides 9.0 Kappa casein 3.3 Lactalbumin 2.7 Serum albumin 1.9 Lysozyme 0.98 Trypsin 0.59 Insulin 0.44 Cytochrome c 0.22 Histone H2B 0.09 Ubiquitin 0.010 Histone H4 0.010
N L Molecular clock hypothesis: implications If protein sequences evolve at constant rates, they can be used to estimate the times that sequences diverged. This is analogous to dating geological specimens by radioactive decay. N = total number of substitutions L = number of nucleotide sites compared between two sequences K = = number of substitutions per nucleotide site See Graur and Li (2000), p. 140
Rate of nucleotide substitution r and time of divergence T r = rate of substitution = 0.56 x 10⁻⁹ per site per year for hemoglobin alpha K = 0.093 = number of substitutions per nucleotide site (rat versus human) r = K / 2T T = .093 / (2)(0.56 x 10⁻⁹) = 80 million years See Graur and Li (2000), p. 140
Neutral theory of evolution Kimura’s (1968) neutral theory of molecular evolution: --the vast majority of DNA changes are not selected for in a Darwinian sense. --The main cause of evolutionary change is random drift of mutant alleles that are selectively neutral (or nearly neutral). --Positive Darwinian selection does occur, but limited role. e.g. the divergent C peptide of insulin changes according to the neutral mutation rate.
“fast-clock” organisms • These organisms with long branches are called “fast-clock” • They really acumulate substitutions faster than the rest of organisms (their rate of substitution is higher) • Some authors have proposed various hypothesis to try to explain this phenomenon: • higher metabolic rate, short generation time, differences in the number of replications of DNA in the germinal line, deficiences in DNA repair, mutagens,
Solutions? • Use methods less sensitive to this type of inconsistency (ML?) • If it is possible, eliminate long branches: • eliminate the “fast-clock” organism • substitute by another of the same group that is not “fast-clock” • increase the number of organisms of that group
Solutions? • We first need to know if we really have a “fast-clock” organism • Relative Rate Test • Sarich and Wilson, 1973 for proteins • Wu and Li (1985) and Li and Tanimura (1987) extended it to nucleotides
O A B C Relative Rate Test • Uses 3 species A, B and one “outgroup” C • Tests if A and B have the same rate of substitution since their split: dAO = dBO dAC = dBC d = dAC - dBC = 0
O A B C Relative Rate Test • This method is time independent • We have to be sure about the phylogeny
O A B C Relative Rate Test • Our null hypothesis is: d = dAC - dBC = 0 • It is assumed that the number of nucleotide substitutions follows a Poisson, • then we can use the standarized normal distribution to test if the number of substituions in the 2 lineages is the same
x + 1.96 x – 1.96 Relative Rate Test • d = dAC - dBC = 0 • d ± Var(d) • Var(d) = Var(dAC) + Var(dBC) - 2 Cov (dAC,dBC) • |d| > 1.96 Var(d) = significant at the 5% level • |d| > 2.96 Var(d) = significant at the 1% level 0
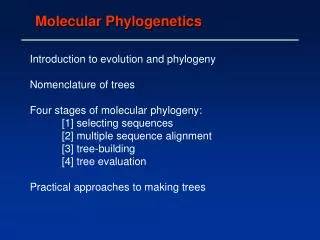
Four stages of phylogenetic analysis Molecular phylogenetic analysis may be described in four stages: [1] Selection of sequences for analysis [2] Multiple sequence alignment [3] Tree building [4] Tree evaluation
Stage 1: Use of DNA, RNA, or protein • Protein alignments are more informative as to structure • function relationships • -Although DNA may be preferable for the phylogenetic • analysis since the protein-coding portion of DNA • has synonymous and nonsynonymous substitutions • -RNA is useful for the other non-protein coding genes • (e.g. tRNAs) if looking at structure-function relationships • But often use the gene instead for phylogeny (e.g. genes • For rRNA)
Stage 1: Use of DNA, RNA, or protein For phylogeny, protein sequences are also often used. --Proteins have 20 states (amino acids) instead of only four for DNA, so there is a stronger phylogenetic signal. Nucleotides are unordered characters: any one nucleotide can change to any other in one step. An ordered character must pass through one or more intermediate states before reaching the final state. Amino acid sequences are partially ordered character states: there is a variable number of states between the starting value and the final value.
Synonymous vs Nonsynonymous rates If the synonymous substitution rate (dS) is greater than the nonsynonymous substitution rate (dN), the DNA sequence is under negative (purifying) selection. This limits change in the sequence (e.g. insulin A chain). If dS < dN, positive selection occurs. For example, a duplicated gene may evolve rapidly to assume new functions.
DNA can be more informative also due to: --Rates of transitions and transversions can be measured. --Noncoding regions (such as 5’ and 3’ untranslated regions) may be analyzed using molecular phylogeny. --Pseudogenes (nonfunctional genes) are studied by molecular phylogeny -- Additional mutational events can be inferred by analysis of ancestral sequences. These changes include parallel substitutions, convergent substitutions, and back substitutions.
-- in order to predict ancestral sequence, other distantly related sequences are analyzed