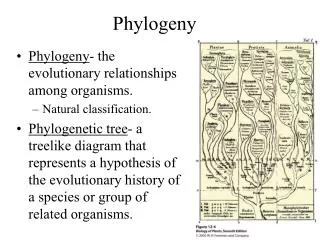
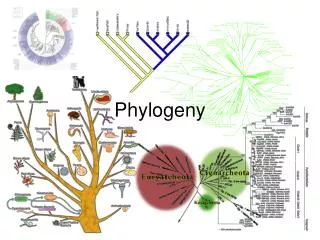
Phylogeny
Phylogeny. Vocabulary of Phylogenetic Trees. Graph of edges and nodes that illustrates the evolutionary relationships among “Operational Taxonomic Units or OTUs” Topology refers to the branching pattern. http://www.ncbi.nlm.nih.gov/About/primer/phylo.html.

Phylogeny
E N D
Presentation Transcript
Vocabulary of Phylogenetic Trees • Graph of edges and nodes that illustrates the evolutionary relationships among “Operational Taxonomic Units or OTUs” • Topology refers to the branching pattern http://www.ncbi.nlm.nih.gov/About/primer/phylo.html
Rooting and Scaling – Same tree, different look? http://www.ncbi.nlm.nih.gov/About/primer/phylo.html
Three different rooted trees consistent with a four taxon unrooted tree What is the total number of possible rooted trees consistent with this unrooted tree? http://www.ncbi.nlm.nih.gov/About/primer/phylo.html
How many possible trees for n taxa? Number of Rooted Trees = (2n -3)! (2 n -2) (n -2)! Number of Unrooted Trees = (2n -5)! (2 n -3) (n -3)!
Phylogeny and Genomics • A species tree provides a framework for analyzing presence and absence of genes in genomes (or traits in organisms) • The species tree may be unknown • A genome is a (comprehensive) source of DNA and (predicted) protein sequences to use for phylogenetic reconstruction • Different regions of the genome may support different trees • Trees are useful for examining evolutionary history of gene families • Knowledge of the species tree affects interpretation of gene family trees.
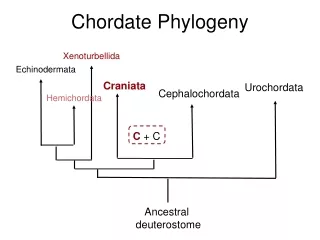
Knowing the relationship between strains and species provides a framework for interpretation Pantoea stewartii Erwinia carotovora Salmonella enterica Yersinia pestis
A reasonable guess based on the character “host type” But is this a good choice if the goal is to reconstruct the “species tree”? Why might you choose to build your tree based on a molecular sequence data rather than phenotype even if what you are really interested in is the evolution of host range? Pantoea stewartii Erwinia carotovora Salmonella enterica Yersinia pestis
Best tree from molecular phylogenetic analysis using multiple core metabolism proteins Pantoea stewartii Why choose to use multiple genes or proteins instead of one? Why choose core metabolism proteins? Why might it be a bad idea? Salmonella enterica Erwinia carotovora Yersinia pestis “True” species tree?
Mapping the trait of interest (phenotypes, presence/absence of genes) onto the species tree Signaling system + Pantoea stewartii - Salmonella enterica + Erwinia carotovora - Yersinia pestis “True” species tree Trait/Gene of Interest
From Multiple Alignment to Phylogeny Ggaccttcgggcctcacgccatcggatgaacccagatgggattagctagtaggtgaggta Organism A ............................................................ Organism B ............................tg.................g.......g.... Organism C .................a.....................................g.... Organism D .......a...............................................g.... Organism E Organism A Organism B Organism C Organism D Organism E
Four Approaches to Tree Reconstruction • Distance Methods (MEGA, PAUP, Phylip) • Estimate a distance matrix • Infer topology and branch lengths • Maximum Parsimony (PAUP) • Sift through all possible trees to find “the one” that requires the smallest number of evolutionary events • Maximum Likelihood (PAUP) • Find the tree most likely to have generated the sequence data • Bayesian (MrBayes) • Produce a probability distribution for all (or a well sampled subset) possible trees using MCMC to explore tree space
Distance matrices and data types • DNA sequence • Protein sequence • Shared gene content • Similarity of gene expression profile • Anything you can represent as a pair-wise distance between OTUs
DNA or Protein? DNA Protein Evolutionary models are available (empirical) Conserved enough to use for distantly related OTUs Can only be used for proteins 20 characters • Well developed evolutionary models • Vary among closely related OTUs • Can be used for regions other than protein coding genes • Can be partitioned into synoymous/nonsynonymous • “Saturate” faster than proteins because there are only 4 characters (GATC)
Distance – in its simplest form is a count of the differences between two sequences Ggaccttcgggcctcacgccatcggatgaacccagatgggattagctagtaggtgaggta Organism A ............................................................ Organism B ............................tg.................g.......g.... Organism C .........a.......a.....................................g.... Organism D .......a.a.............................................g.... Organism E A B C D E Organism A - 0 4 3 3 Organism B - 4 3 3 Organism C - 4 4 Organism D - 2 Organism E - USE AN EVOLUTIONARY MODEL TO CORRECT THE DISTANCE MATRIX FOR UNOBSERVED CHANGES.
Five Models for Nucleotide Substitution(There are others) Jukes and Cantor, 1969 All substitutions are equally likely Kimura, 1980 Transitions are more likely than transversions Tamura Transitions are more likely that transversions and GC content does not equal AT content. Tamura and Nei Transitions are more likely than transversions AND GC-content doesn’t equal the AT-content AND there is a rate difference between G-A and T-C transitions Unrestricted There is no discernable relationship between rates
Models of Nucleotide Substitution An element of eij of the matrix stands for the substitution rate from the nucleotide in the ith row to the nucleotide in the jth column A T C G A - a a a T a - a a C a a - a G a a a - A T C G A - b b a T b - a b C b a - a G a b b - Jukes-Cantor Kimura
Rate Heterogeneity • Instead of assuming a uniform distribution across the alignment allow rate to vary according to the gamma family of distributions Alpha < 1 there is strong among-site variation Higher alpha, lower heterogeneity Can be estimated for individual data sets
Infer topology and branch lengths from the matrix using an algorithm like UPGMA UPGMA (Unweighted Pair Group Method with Arithmetic mean) is a simple method that is also used for microarray clustering. Assumes constant rates of evolution among different lineages -> linear relationship between distance and time A B C D E Organism A - 0.00 0.04 0.03 0.03 Organism B - 0.04 0.03 0.03 Organism C - 0.04 0.04 Organism D - 0.02 Organism E -
UPGMA Step 1- Cluster the Operational Taxonomic UnitsOTUs with the smallest distance with branch length = d/2 A B C D E Organism A - 0.00 0.04 0.03 0.03 Organism B - 0.04 0.03 0.03 Organism C - 0.04 0.04 Organism D - 0.02 Organism E - Organism A Organism B time
UPGMA Step 2- Collapse the distance matrix to reflect distance from the AB group by taking the average of the distance from A-all others and B-all others A B C D E Organism A - 0.00 0.04 0.03 0.03 Organism B - 0.04 0.03 0.03 Organism C - 0.04 0.04 Organism D - 0.02 Organism E - AB C D E Group AB - 0.04 0.03 0.03 Organism C - 0.04 0.04 Organism D - 0.02 Organism E -
UPGMA Step 3- • Repeat Step 1 with the collapsed distance matrix • Step 1- Cluster OTUs with the smallest distance with branch length = d/2 AB C D E Group AB - 0.04 0.03 0.03 Organism C - 0.04 0.04 Organism D - 0.02 Organism E - Organism A Organism B 0.01 Organism D Organism E 0.01 time
UPGMA Step 4- n Continue to collapse and join until all taxa are added AB C DE Group AB - 0.04 0.03 Organism C - 0.04 Group DE - ABDE C Group ABDE - 0.04 Organism C - 0.015 Organism A Organism B 0.005 0.01 Organism D Organism E 0.005 0.01 0.02 Organism C time
Alternative to UPGMA that does not assume a constant evolutionary rate Neighbor-joining takes a step-wise approach similar to UPGMA, but chooses branch lengths that minimize the total branch length (minimum evolution) at every step. Not guaranteed to get the overall optimal (minimal branch length) tree because it is a greedy algorithm. Distance methods are fast and scale well for large number of taxa.
Maximum Parsimony - Sift through all possible trees to find “the one” that requires the smallest number of evolutionary events With so many trees, it is often necessary to use a heuristic approach that looks at a subset of all possible trees (TBR, Branch and Bound) (2n-5)! 2n-3(n-3)! (2n-3)! 2n-2(n-2)! rooted unrooted Organism A Organism B Organism D Organism E Organism C time
Maximum Parsimony Ggaccttcgggcctcacgccatcggatgaacccagatgggattagctagtaggtgaggta Organism A ............................................................ Organism B ............................tg.................g.......g.... Organism C .................a.....................................g.... Organism D .......a...............................................g.... Organism E g -> a Organism A a Organism B a 1 event g g Organism D g Organism E g g Organism C g time
Maximum Parsimony Ggaccttcgggcctcacgccatcggatgaacccagatgggattagctagtaggtgaggta Organism A ............................................................ Organism B ............................tg.................g.......g.... Organism C .................a.....................................g.... Organism D .......a...............................................g.... Organism E Organism A a Organism E g 3 events a a -> g Organism D g Organism B a a -> g a Organism C g a -> g time
Maximum Parsimony 1 event Right tree? 3 events Wrong tree? g -> a Organism A Organism B Organism A a Organism E g g a a -> g g Organism D Organism E Organism D g Organism B a a -> g g a Organism C Organism C g a -> g time time
Maximum Parsimony 1 event Right tree? 3 events Wrong tree? g -> a Organism A Organism B Organism A a Organism E g g a a -> g g Organism D Organism E Organism D g Organism B a a -> g g a Organism C Organism C g a -> g time time
Maximum Likelihood Methods • Given an evolutionary model, evaluate all possible tree topologies and calculate the probability of generating the observed data. • Choose the tree with the highest probability (generally expressed as the log likelihood) • Computationally intensive and sensitive to model selection
Bootstrapping Ggaccttcgggcctcacgccatcggatgaacccagatgggattagctagtaggtgaggta Organism A ............................................................ Organism B ............................tg.................g.......g.... Organism C .................a.....................................g.... Organism D .......a...............................................g.... Organism E Ggaccttcgggcctcacgccatcggatgaacccagatgggattagctagtaggtgaggta Organism A ............................................................ Organism B ............................tg.................g.......g.... Organism C .................a.....................................g.... Organism D .......a...............................................g.... Organism E Ggaccttcgggcctcacgccatcggatgaacccagatgggattagctagtaggtgaggta Organism A ............................................................ Organism B ............................tg.................g.......g.... Organism C .................a.....................................g.... Organism D .......a...............................................g.... Organism E Ggaccttcgggcctcacgccatcggatgaacccagatgggattagctagtaggtgaggta Organism A ............................................................ Organism B ............................tg.................g.......g.... Organism C .................a.....................................g.... Organism D .......a...............................................g.... Organism E Ggaccttcgggcctcacgccatcggatgaacccagatgggattagctagtaggtgaggta Organism A ............................................................ Organism B ............................tg.................g.......g.... Organism C .................a.....................................g.... Organism D .......a...............................................g.... Organism E Ggaccttcgggcctcacgccatcggatgaacccagatgggattagctagtaggtgaggta Organism A ............................................................ Organism B ............................tg.................g.......g.... Organism C .................a.....................................g.... Organism D .......a...............................................g.... Organism E Ggaccttcgggcctcacgccatcggatgaacccagatgggattagctagtaggtgaggta Organism A ............................................................ Organism B ............................tg.................g.......g.... Organism C .................a.....................................g.... Organism D .......a...............................................g.... Organism E Ggaccttcgggcctcacgccatcggatgaacccagatgggattagctagtaggtgaggta Organism A ............................................................ Organism B ............................tg.................g.......g.... Organism C .................a.....................................g.... Organism D .......a...............................................g.... Organism E Ggaccttcgggcctcacgccatcggatgaacccagatgggattagctagtaggtgaggta Organism A ............................................................ Organism B ............................tg.................g.......g.... Organism C .................a.....................................g.... Organism D .......a...............................................g.... Organism E Ggaccttcgggcctcacgccatcggatgaacccagatgggattagctagtaggtgaggta Organism A ............................................................ Organism B ............................tg.................g.......g.... Organism C .................a.....................................g.... Organism D .......a...............................................g.... Organism E Ggaccttcgggcctcacgccatcggatgaacccagatgggattagctagtaggtgaggta Organism A ............................................................ Organism B ............................tg.................g.......g.... Organism C .................a.....................................g.... Organism D .......a...............................................g.... Organism E Ggaccttcgggcctcacgccatcggatgaacccagatgggattagctagtaggtgaggta Organism A ............................................................ Organism B ............................tg.................g.......g.... Organism C .................a.....................................g.... Organism D .......a...............................................g.... Organism E A method of testing the reliability of the tree 100% Organism A Organism B Organism C Organism D Organism E 50% 100%
Bootstrap to Assess Confidence in Branches Ggaccttcgggcctcacgccatcggatgaacccagatgggattagctagtaggtgaggta Organism A ............................................................ Organism B ............................tg.................g.......g.... Organism C .................a.....................................g.... Organism D .......a...............................................g.... Organism E Resample with replacement to produce 1000 alignments of the same size c . . . .
Bootstrap to Assess Confidence in Branches ggaccttcgggcctcacgccatcggatgaacccagatgggattagctagtaggtgaggta Organism A ............................................................ Organism B ............................tg.................g.......g.... Organism C .................a.....................................g.... Organism D .......a...............................................g.... Organism E Resample with replacement to produce 1000 alignments of the same size c c . . . . . . . .
Bootstrap to Assess Confidence in Branches ggaccttcgggcctcacgccatcggatgaacccagatgggattagctagtaggtgaggta Organism A ............................................................ Organism B ............................tg.................g.......g.... Organism C .................a.....................................g.... Organism D .......a...............................................g.... Organism E Resample with replacement to produce 1000 alignments of the same size c c a . . . . . g . . . . . .
Bootstrap to Assess Confidence in Branches ggaccttcgggcctcacgccatcggatgaacccagatgggattagctagtaggtgaggta Organism A ............................................................ Organism B ............................tg.................g.......g.... Organism C .................a.....................................g.... Organism D .......a...............................................g.... Organism E Resample with replacement to produce 1000 alignments of the same size c c a t g g a . . . . . . . . . g . . . g . . . . . a . . . . . . . .
Many different Alignments Ggaccttcgggcctcacgccatcggatgaacccagatgggattagctagtaggtgaggta Organism A ............................................................ Organism B ............................tg.................g.......g.... Organism C .................a.....................................g.... Organism D .......a...............................................g.... Organism E Ggaccttcgggcctcacgccatcggatgaacccagatgggattagctagtaggtgaggta Organism A ............................................................ Organism B ............................tg.................g.......g.... Organism C .................a.....................................g.... Organism D .......a...............................................g.... Organism E Ggaccttcgggcctcacgccatcggatgaacccagatgggattagctagtaggtgaggta Organism A ............................................................ Organism B ............................tg.................g.......g.... Organism C .................a.....................................g.... Organism D .......a...............................................g.... Organism E Ggaccttcgggcctcacgccatcggatgaacccagatgggattagctagtaggtgaggta Organism A ............................................................ Organism B ............................tg.................g.......g.... Organism C .................a.....................................g.... Organism D .......a...............................................g.... Organism E Ggaccttcgggcctcacgccatcggatgaacccagatgggattagctagtaggtgaggta Organism A ............................................................ Organism B ............................tg.................g.......g.... Organism C .................a.....................................g.... Organism D .......a...............................................g.... Organism E Ggaccttcgggcctcacgccatcggatgaacccagatgggattagctagtaggtgaggta Organism A ............................................................ Organism B ............................tg.................g.......g.... Organism C .................a.....................................g.... Organism D .......a...............................................g.... Organism E Ggaccttcgggcctcacgccatcggatgaacccagatgggattagctagtaggtgaggta Organism A ............................................................ Organism B ............................tg.................g.......g.... Organism C .................a.....................................g.... Organism D .......a...............................................g.... Organism E Ggaccttcgggcctcacgccatcggatgaacccagatgggattagctagtaggtgaggta Organism A ............................................................ Organism B ............................tg.................g.......g.... Organism C .................a.....................................g.... Organism D .......a...............................................g.... Organism E Ggaccttcgggcctcacgccatcggatgaacccagatgggattagctagtaggtgaggta Organism A ............................................................ Organism B ............................tg.................g.......g.... Organism C .................a.....................................g.... Organism D .......a...............................................g.... Organism E Ggaccttcgggcctcacgccatcggatgaacccagatgggattagctagtaggtgaggta Organism A ............................................................ Organism B ............................tg.................g.......g.... Organism C .................a.....................................g.... Organism D .......a...............................................g.... Organism E Ggaccttcgggcctcacgccatcggatgaacccagatgggattagctagtaggtgaggta Organism A ............................................................ Organism B ............................tg.................g.......g.... Organism C .................a.....................................g.... Organism D .......a...............................................g.... Organism E Ggaccttcgggcctcacgccatcggatgaacccagatgggattagctagtaggtgaggta Organism A ............................................................ Organism B ............................tg.................g.......g.... Organism C .................a.....................................g.... Organism D .......a...............................................g.... Organism E Ggaccttcgggcctcacgccatcggatgaacccagatgggattagctagtaggtgaggta Organism A ............................................................ Organism B ............................tg.................g.......g.... Organism C .................a.....................................g.... Organism D .......a...............................................g.... Organism E
Many different Alignments Ggaccttcgggcctcacgccatcggatgaacccagatgggattagctagtaggtgaggta Organism A ............................................................ Organism B ............................tg.................g.......g.... Organism C .................a.....................................g.... Organism D .......a...............................................g.... Organism E Ggaccttcgggcctcacgccatcggatgaacccagatgggattagctagtaggtgaggta Organism A ............................................................ Organism B ............................tg.................g.......g.... Organism C .................a.....................................g.... Organism D .......a...............................................g.... Organism E Ggaccttcgggcctcacgccatcggatgaacccagatgggattagctagtaggtgaggta Organism A ............................................................ Organism B ............................tg.................g.......g.... Organism C .................a.....................................g.... Organism D .......a...............................................g.... Organism E Ggaccttcgggcctcacgccatcggatgaacccagatgggattagctagtaggtgaggta Organism A ............................................................ Organism B ............................tg.................g.......g.... Organism C .................a.....................................g.... Organism D .......a...............................................g.... Organism E Ggaccttcgggcctcacgccatcggatgaacccagatgggattagctagtaggtgaggta Organism A ............................................................ Organism B ............................tg.................g.......g.... Organism C .................a.....................................g.... Organism D .......a...............................................g.... Organism E Ggaccttcgggcctcacgccatcggatgaacccagatgggattagctagtaggtgaggta Organism A ............................................................ Organism B ............................tg.................g.......g.... Organism C .................a.....................................g.... Organism D .......a...............................................g.... Organism E Ggaccttcgggcctcacgccatcggatgaacccagatgggattagctagtaggtgaggta Organism A ............................................................ Organism B ............................tg.................g.......g.... Organism C .................a.....................................g.... Organism D .......a...............................................g.... Organism E Ggaccttcgggcctcacgccatcggatgaacccagatgggattagctagtaggtgaggta Organism A ............................................................ Organism B ............................tg.................g.......g.... Organism C .................a.....................................g.... Organism D .......a...............................................g.... Organism E Ggaccttcgggcctcacgccatcggatgaacccagatgggattagctagtaggtgaggta Organism A ............................................................ Organism B ............................tg.................g.......g.... Organism C .................a.....................................g.... Organism D .......a...............................................g.... Organism E Ggaccttcgggcctcacgccatcggatgaacccagatgggattagctagtaggtgaggta Organism A ............................................................ Organism B ............................tg.................g.......g.... Organism C .................a.....................................g.... Organism D .......a...............................................g.... Organism E Ggaccttcgggcctcacgccatcggatgaacccagatgggattagctagtaggtgaggta Organism A ............................................................ Organism B ............................tg.................g.......g.... Organism C .................a.....................................g.... Organism D .......a...............................................g.... Organism E Ggaccttcgggcctcacgccatcggatgaacccagatgggattagctagtaggtgaggta Organism A ............................................................ Organism B ............................tg.................g.......g.... Organism C .................a.....................................g.... Organism D .......a...............................................g.... Organism E What percentage of the datasets support each branch? 100% Organism A Organism B Organism C Organism D Organism E 50% 100%
Bootstrapping and what it really tells us. The underlying rational behind bootstrapping is to predict what would happen if more data were collected or small perturbations were made to the existing data. Bootstrapping does not indicate the chance that the branch topology is in the correct location. (Holder, M., Lewis, P. 2003) More simulated data Ggaccttcgggcctcacgccatcggatgaacccagatgggattagctagtaggtgaggta Organism A ............................................................ Organism B ............................tg.................g.......g.... Organism C .................a.....................................g.... Organism D .......a...............................................g.... Organism E Ggaccttcgggcctcacgccatcggatgaacccagatgggattagctagtaggtgaggta Organism A ............................................................ Organism B ............................tg.................g.......g.... Organism C .................a.....................................g.... Organism D .......a...............................................g.... Organism E Ggaccttcgggcctcacgccatcggatgaacccagatgggattagctagtaggtgaggta Organism A ............................................................ Organism B ............................tg.................g.......g.... Organism C .................a.....................................g.... Organism D .......a...............................................g.... Organism E Ggaccttcgggcctcacgccatcggatgaacccagatgggattagctagtaggtgaggta Organism A ............................................................ Organism B ............................tg.................g.......g.... Organism C .................a.....................................g.... Organism D .......a...............................................g.... Organism E Ggaccttcgggcctcacgccatcggatgaacccagatgggattagctagtaggtgaggta Organism A ............................................................ Organism B ............................tg.................g.......g.... Organism C .................a.....................................g.... Organism D .......a...............................................g.... Organism E Ggaccttcgggcctcacgccatcggatgaacccagatgggattagctagtaggtgaggta Organism A ............................................................ Organism B ............................tg.................g.......g.... Organism C .................a.....................................g.... Organism D .......a...............................................g.... Organism E Ggaccttcgggcctcacgccatcggatgaacccagatgggattagctagtaggtgaggta Organism A ............................................................ Organism B ............................tg.................g.......g.... Organism C .................a.....................................g.... Organism D .......a...............................................g.... Organism E
Genome-scale phylogeny • Total Evidence approach - generate one tree from all available data • Consensus approach – generate a tree for each gene and generate an average tree • Network approach – show different relationships for different genes rather than a single bifurcating tree
Total Evidence – concated 976 protein multiple alignments Majority Rule Consensus -976 separate Bayesian phylogenies Network representation of all topologies Ma et al. unpublished analysis of 976 sets of orthologs from 8 enterobacteria and an outgroup.
An example of incongruence between different genes in Lactobacillus genomes Nicolas et al. BMC Evolutionary Biology 2007; 7:141 Analyzed 480 proteins 3:2 ratio of genes supporting Ta vs. Tb, but Tc is almost never seen.