Download
1 / 40
400 likes | 531 Vues
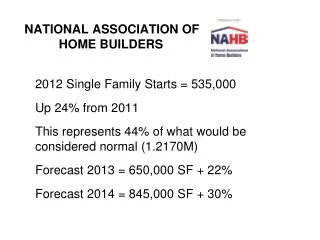
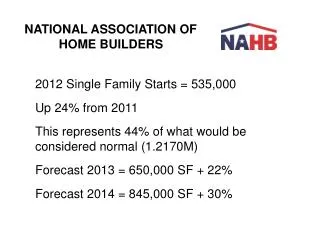
NATIONAL ASSOCIATION OF HOME BUILDERS. 2012 Single Family Starts = 535,000 Up 24% from 2011 This represents 44% of what would be considered normal (1.2170M) Forecast 2013 = 650,000 SF + 22% Forecast 2014 = 845,000 SF + 30%. CORE LOGIC. IN 2012: Total Homes Sales Increased 6%

E N D
NATIONAL ASSOCIATION OF HOME BUILDERS 2012 Single Family Starts = 535,000 Up 24% from 2011 This represents 44% of what would be considered normal (1.2170M) Forecast 2013 = 650,000 SF + 22% Forecast 2014 = 845,000 SF + 30%
CORE LOGIC IN 2012: • Total Homes Sales Increased 6% • Non-Distressed Home Sales Increased 11% • REO Sales Declined 20% (3rd consecutive decline) • Serious Delinquencies Dropped 7.4% 6.9% • Core Logic Home Price Index (based on repeat sales) Increased 6.3% (largest since 2006)
GLAR MLS 2012 • Existing Home Sales Have Posted Six Consecutive Quarters of Sales Growth (starting in Q3 2011) Houses Sold on MLS ‘06 ‘07 ‘08 ‘09 ‘10 ‘11 ‘ 12 ‘12 vs.’11 15,181 14,748 11,369 11,648 11,442 10,974 12,724 +15.9% Median Sales Price ‘06 ‘07 ‘08 ‘09 ‘10 ‘11 ‘ 12 ‘12 vs.’11 138.5 139.0 134.9 132.0 138.0 134.1 140.0 +4.3% • Average and Cumulative Day on Market Both Down in ’12 vs. ‘11
PERCENT CHANGE IN HOUSE PRICES/MSA National MSARank1-yr Qtr.5-yr Birmingham, AL 222 -1.3% -0.2 -8.8% Charlotte, NC 201 -0.8% 0.4 -12.9% Cincinnati, OH 213 -1.0% -0.5 -8.3% Cleveland, OH 265 -2.2% - -13.3% Columbus, OH 186 -0.3% -0.3 -6.9% Dayton, OH 212 -1.0% 0.1 -9.9% Houston, TX 30 3.4% 0.9 5.5% Indianapolis, IN 149 0.3% 0.2 -3.9% Knoxville, TN 156 0.1% 0.6 -5.5% Memphis, TN 206 -1.0% -0.1 -12.1% Louisville, KY 133 0.6% 0.4 -2.8% Oklahoma City 64 2.0% 0.7 2.2% Portland, OR 66 2.0% 1.8 -21.0% Raleigh, NC 181 -0.2% - -6.6% Richmond, VA 230 -1.5% - -18.1% Seattle, WA 63 2.0% 1.4 -23.1% Source: Federal Housing Finance Agency
TOP 20 MSA LARGEST5-YEAR PERCENT LOSS IN HOME PRICES Las Vegas, NV -54.3% Vallejo, CA -45.6% Stockton, CA -44.9% Daytona Beach, FL -44.3% Reno, NV -44.0% Orlando, FL -42.8% Ocala, FL -42.7% Salvias, CA -41.7% Lakeland-Winter Haven, FL -41.6% Riverside – San Bernadine, CA -41.3% Port St. Lucie, FL -40.9% Yuba City, CA -40.7% Naples – Marco Island, FL -40.1% Visalia, CA -39.8% Ft. Lauderdale, FL -39.0% Palm Bay – Melbourne, FL -38.8% Fresno, CA -38.5% Phoenix, AZ -38.4% Bradenton – Sarasota, FL -38.0% West Palm Beach, FL -37.8% Cape Coral – Ft. Myers, FL -37.8% Louisville, KY -2.8% Source: Federal Housing Finance Agency
Residential Building Permits 2012 20122011’12 vs ’11 Jefferson 1003 671 +49.4 Oldham 156 112 39.3 Shelby 136 73 86.3 Spencer 47 46 2.2 Bullitt 29221337.1 1634 1115 +46.5% Clark 349 227 +53.7 Floyd 169 98 72.4 Harrison 96 6450.0 614 389 +57.8% 8-County Total 2,248 1504 +49.5% Note: Nelson 114 122 -6.6% Hardin 254 210 +21% Source: The Market Edge
Residential Building Permit 2012Market Comparison %CHANGE MARKET 2012 vs. 2011 Louisville KY 42.5% Lexington KY 33.1% Evansville IN 24.3% Asheville NC 21.5% Charlotte NC 30.4% Fayetteville NC ------- Hickory NC 12.3% Triad NC 3.2% Raleigh NC 31.8% Upstate NC 32.1% Chattanooga TN 27.7% Knoxville TN 23.9% Tri-Cities TN -4.5% Source: The Market Edge
Improving Markets Index 259 242 201 125 101 99 100 98 99 103 84 80 80 76 41 30 23 12
5294 5137 5015 4790 4348 4225 Permits 3749 3297
5294 5137 5015 4790 4348 4225 Permits 3749 3297
97.5% 59.6% 52.6% 49.5% 48.8% 38.6% 34.2% 29.9% 13.2% -1.2% -2.4% -11.7% -18% -22.5% -27.7% Source: local government permitting departments
NAHB E-BOOK/SURVEY RESULTSWHAT HOME BUYERS REALLY WANT The lot size is not a factor for 25% of buyers 47% want three bedrooms 32% want four bedrooms 57% of home buyers prefer a single-story home 31% prefer two stories Source: “What Home Buyers Really Want”, National Association of Home Builders NAHB Economics & Housing Policy Group
60 % of buyers want a full or partial basement48% want the Master Bedroom on the 2nd floor70% prefer the Washer & Dryer on the 1st floorBuyers focus on “Quality & Appearance” where looking at home components such as flooring, doors, kitchen countertops, cabinets, etc. while…When looking at appliances, the focus is on “Quality & Brand”Source: “What Home Buyers Really Want”, National Association of Home Builders NAHB Economics & Housing Policy Group
In the Kitchen: A walk-in pantry, table space for eating and a double sink are considered essential/desirable by 84% of buyers • In the Bathroom: An exhaust fan, linen closet and both a shower stall and tub in Master bath are essential/desirable to 80% of buyers Source: “What Home Buyers Really Want”, National Association of Home Builders NAHB Economics & Housing Policy Group
When Rating Windows: 67% want energy star rated windows, triple pane insulating glass and low-e insulating glass • Decorative Features: 88% Want ceiling fans 60% Want built-in shelving and ceiling crown molding Source: “What Home Buyers Really Want”, National Association of Home Builders NAHB Economics & Housing Policy Group
Laundry Room: 57% Buyers find it essential and would not buy a home without it 36% Find it desirable • Garage Storage: 32% Rate it essential 54% Desirable Source: “What Home Buyers Really Want”, National Association of Home Builders NAHB Economics & Housing Policy Group
The Three Most Wanted Outdoor Features: 90% Exterior lighting essential/desirable 83% Patio 80% Front porch • Master Bath Location: 45% Essential 36% Desirable Source: “What Home Buyers Really Want”, National Association of Home Builders NAHB Economics & Housing Policy Group
62% Would choose a smaller home with higher quality products and amenities than a larger home with fewer amenities • 73% Agree that the projected utility costs of a home would influence their decision today • 71% Would prefer to buy a home from a builder that provides home energy ratings Source: “What Home Buyers Really Want”, National Association of Home Builders NAHB Economics & Housing Policy Group
Location of choice for new home buyers: Central City – 8 % Close-in Suburbs – 30% Outlying Suburb – 38% Rural Area – 27 % and small towns • Community features to seriously influence the buying decision: Walking/Jogging Trails – 60% Park Area - 54% Outdoor Swimming Pool – 50% Source: “What Home Buyers Really Want”, National Association of Home Builders NAHB Economics & Housing Policy Group
70% of home buyers see value in professional designations for building/remodeling contractors • “More Professional & Credible” • “Provide better quality work and craftmanship” • “Provide better service levels” • “More Reliable” Top Two Reasons for Selecting a Contractor: 1. “Reputation for quality construction” 2. “Reputation for completing projects on budget” Source: “What Home Buyers Really Want”, National Association of Home Builders NAHB Economics & Housing Policy Group
Type of Home Preferred (Percent of Respondents) Source: “What Home Buyers Really Want”, National Association of Home Builders NAHB Economics & Housing Policy Group
Features Most Wanted by Home Buyers (Percent of Respondents) 36% 58% 57% 36% 28% 63% 53% 37% 41% 49% 51% 39% 35% 54% 40% 48% 32% 54% 49% 36% 54% 31% Source: “What Home Buyers Really Want”, National Association of Home Builders NAHB Economics & Housing Policy Group
Outdoor Features Rated Essential or Desirable (Percent of Respondents) 41% 49% 56% 27% 26% 54% 29% 49% 22% 55% 51% 21% 45% 17% 39% 21% 31% 6% 27% 6% Source: “What Home Buyers Really Want”, National Association of Home Builders NAHB Economics & Housing Policy Group
Accessibility Features Rated Essential or Desirable (Percent of Respondents) Source: “What Home Buyers Really Want”, National Association of Home Builders NAHB Economics & Housing Policy Group
Accessibility Features - History (Percent of Respondents Rating Essential of Desirable in 2012 and Important to Very Important in 2004 and 2007 ) Source: “What Home Buyers Really Want”, National Association of Home Builders NAHB Economics & Housing Policy Group
Share of Buyers Willing to Buy Home W/out a Living Room by Division (Percent of Respondents ) Source: “What Home Buyers Really Want”, National Association of Home Builders NAHB Economics & Housing Policy Group
Amenities that Would Seriously Influence Buyers to Choose a Community (Percent of Respondents ) Source: “What Home Buyers Really Want”, National Association of Home Builders NAHB Economics & Housing Policy Group
Community Features that Influence Purchase Decision - History (Percent of Respondents ) Source: “What Home Buyers Really Want”, National Association of Home Builders NAHB Economics & Housing Policy Group
Community Features that Influence Purchase Decision – History Cont. (Percent of Respondents ) Source: “What Home Buyers Really Want”, National Association of Home Builders NAHB Economics & Housing Policy Group
NATIONAL ASSOCIATION OF REALTORS2011 COMMUNITY PREFERENCE SURVEY
61% Choose larger lots and needing to drive, than 37% who choose to live on smaller lots within walking distance to schools, stores and restaurants 78% Americans consider being within 30-minutes of work important in choosing where to live. 88% Say the neighborhood where the house is located is a bigger consideration where to live than the size of the house. Important Choice Decisions 77% Sidewalks and places to take a walk 75% High quality public schools Source: National Realtors Association 2011 Community Survey
Importance of Community Characteristics Source: National Realtors Association 2011 Community Survey
Preferred Versus Actual Community Type 8% 5% 11% 19% 28% 26% 12% 19% 18% 14% 22% 16% Source: National Realtors Association 2011 Community Survey
Preferred Versus Actual Housing Type Source: National Realtors Association 2011 Community Survey