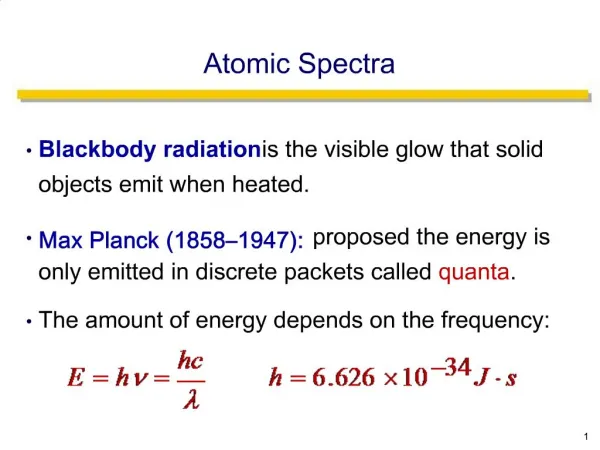
pT Spectra
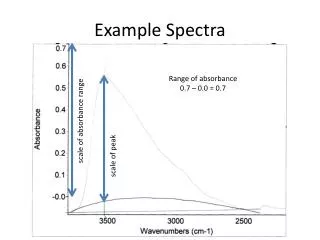
pT Spectra. Jaiby Joseph 04/18/2011. Method . Signal (1.82 < Mass < 1.92). Bkg_Right 1.94 ≤ Mass < 1.99. Bkg_Left 1.75 < Mass ≤ 1.8. Subtract the background pT distribution (Sum of left and right) from the signal pT distribution in the above shown ranges.

pT Spectra
E N D
Presentation Transcript
pT Spectra Jaiby Joseph 04/18/2011
Method Signal (1.82 < Mass < 1.92) Bkg_Right 1.94 ≤ Mass < 1.99 Bkg_Left 1.75 < Mass ≤ 1.8 • Subtract the background pT distribution (Sum of left and right) from the signal pT distribution in the above shown ranges. • Normalize the background using the Background fitted function in the signal region
pT distribution of D0+D0bar No normalization of B (d2N/dpTdy) Vs pT (d2N/dpTdy) Vs pT Linear scale Log scale 1/pT(d2N/dpTdy) Vs pT 1/pT(d2N/dpTdy) Vs pT Linear scale Log scale
pT spectra with B normalization Normalization: To do the normalization a) Count the number of entries under the B fit function from 1.82-1.92 b) Get the histogram counts from 5 bins on Left+Right (1.75-1.8)+(1.94-1.99) c) Normalize the background pT distribution histo with (a/b) 0-10% I get 5095171 counts from the summed pT distribution of Left+Right of D0+D0bar I get 5227370 counts under the B fit function in the Inv Mass peak region of D0+D0bar Normalize (1) with (2). MinBias I get 8652207 counts from the summed pT distribution of Left+Right of D0+D0bar I get 8873550 counts under the B fit function in the Inv Mass peak region of D0+D0bar Normalize (1) with (2).
UnweighedpT Spectra of 0-10% Before B normalization B Normalized
Weighed pT Spectra of 0-10% After B Normalization Before B Normalization
UnweighedpT Spectra of MB Before B Normalization After B Normalization
Weighed pT Spectra of MB After B Normalization Before B Normalization
Done with Normalized Bkg 0-10% MB
Raw Histograms of 0-10%, pT weighed spectra pT weighed 0-10% D0_bkgLeft D0_bkgRight D0bar_bkgLeft D0bar_bkgRight
Subtracted (0-10%) The subtracted counts (# of entries) should be 155867
Inv Mass for pT slices 0.1 < PtD0 < 0.5