
CONCLUSIONS
This study explores the gene expression responses of human liver adult stem cells (HL1-1) to varying doses of TCDD, a known environmental contaminant and aryl hydrocarbon receptor (AhR) ligand. We conducted both time-course and dose-response experiments, identifying 251 differentially expressed genes via microarray analysis. The results highlighted significant temporal and dose-dependent changes in gene expression, with a focus on primary response genes and their conservation across species. These findings enhance the understanding of TCDD's effects and potential biomarkers for toxicity prediction.

CONCLUSIONS
E N D
Presentation Transcript
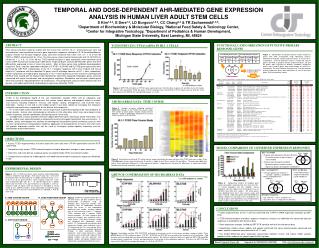
TEMPORAL AND DOSE-DEPENDENT AHR-MEDIATED GENE EXPRESSION ANALYSIS IN HUMAN LIVER ADULT STEM CELLS S Kim1,2,3, E Dere1,2, LD Burgoon1,2,3, CC Chang2,4 & TR Zacharewski1,2,3. 1Department of Biochemistry & Molecular Biology, 2National Food Safety & Toxicology Center, 3Center for Integrative Toxicology, 4Department of Pediatrics & Human Development, Michigan State University, East Lansing, MI, 48824 ABSTRACT FUNCTIONAL CATEGORIZATION OF PUTATIVE PRIMARY RESPONSE GENES Time course and doseresponse studies with the human liver cell line, HL1-1, which possesses stem cell characteristics, were conducted to assess gene expression responses elicited by 2,3,7,8-tetrachlorodibenzo-p-dioxin (TCDD). For the doseresponse study, cells were treated for with 0.001, 0.01, 0.1, 1, 10 or 100 nM TCDD or DMSO vehicle control for 12 hrs. The time course study involved treating cells with 10 nM TCDD or vehicle for 1, 2, 4, 8, 12, 24 or 48 hrs. TCDD-elicited changes in gene expression were monitored using human cDNA microarrays consisting of 7,844 genes. Empirical Bayes analysis identified 251 genes that were differentially expressed at one or more time points. Most of these genes also exhibited dose-dependent responses. Dose- and time- dependent induction of CYP1B1, ALDH1A3 and SLC7A5 gene expressions were confirmed by QRT-PCR. Comparisons of the HL1-1 temporal responses with human HepG2 and mouse Hepa1c1c7 hepatoma cell lines identified 75 genes and 18 orthologs common to HL1-1 cells, respectively. Further comparison of temporal gene expression in HL1-1 with hepatic tissue from immature ovariectomized C57BL/6 mice treated with 30 mg/kg TCDD identified 32 commonly regulated orthologous genes, primarily associated with signal transduction and transcriptional regulation. Metabolism and transport related genes were also commonly regulated between all comparisons. This comparative analysis further demonstrates the species- and model-specific AhR-mediated gene expression elicited by TCDD. Figure 7: Identification of putative primary TCDD responsive genes from CHX co-treatment study. Microarray analysis identified 79 and 203 TCDD-responsive genes at 4 and 12 hr, respectively. CHX co-treatment analysis resulted 48 and 53 genes classified as putative primary responsive genes, 20 and 95 genes were classified to putative secondary responsive genes, and 11 and 55 genes were unclassifiable at 4 and 12 hr, respectively. The Venn diagram illustrates that 79 of the putative primary responsive genes were identified in 4 and 12 hour time points CHX co-treatment studies. 79 putative primary response genes INTRODUCTION TCDD is the prototypical ligand of the aryl hydrocarbon receptor (AhR) and an ubiquitous and bioaccumulative environmental contaminant that causes various adverse and biological effects in animals and humans including endocrine, immuno- and hepato- toxicity, teratogenesis, and multi-site tumor promotion. Various in vivo and in vitro model systems have been utilized to investigate the molecular networks and mechanisms responsible for the diverse toxic responses. An in vitro model system derived from human target tissue is generally expected to be more predictive of human toxicity. Human stem cells provide an attractive in vitro alternative, which may more closely mimic human responses, and be a potentially unlimited source of human cells. Toxicogenomic analysis provides extensive global differential gene expression profile information, that can be used to more accurately predict a compound's toxicity and support quantitative risk assessments. In addition, 'omics' technologies may facilitate the development of predictive toxicity screening assays as well as more comprehensive computational modeling. Application of toxicogenomics to human liver stem cells will provide expression profiles that can be used to investigate species-specific responses and the identification putative biomarkers. OBJECTIVES • Assess TCDD responsiveness of human adult liver stem cells with CYP1A1 quantitative real-time PCR (QRT-PCR) • Comprehensively assess TCDD induced temporal and dose dependent changes in gene expression • Determine and verify primary response genes via cycloheximide (CHX) co-treatment studies • Comparatively evaluate the model-specific and model-conserved gene expression responses elicited by TCDD HL1-1 vs. HepG2 • 55 genes were regulated in the same direction - 13 putative primary responsive genes were included • 19 genes were divergently regulated - No putative primary responsive gene - Signal transduction, development related genes HL1-1 vs. Hepa1c1c7 • Cell cycle progression and arrest • - CDCA5↑, CDKN1C↓, MCM3AP↓ • Matrix metalloproteinase • - MMP13↑ HL1-1 vs. Mm liver • Transcription factors • Signal transductions • Lipid metabolism Divergent responses • ID3 : Mm liver↑ / HL1-1 & Hepa1c1c7↓ • SLC12A7 : HL1-1↑ / Hepa1c1c7 & Mm liver↓ CONCLUSIONS • TCDD responsiveness of HL1-1 cell was confirmed with CYP1A1 mRNA expression induction by QRT-PCR • TCDD-elicited temporal and dose response microarray analysis has identified the conserved classical responses in accordance with literature data • Gene expression changes verified by QRT-PCR correlate well with the microarray data • Comparative studies across models and species confirmed that some toxicity-related, conserved and model- specific responseswere observed in HL1-1 cells • The limited differential gene expression conservation between human and mouse model systems provides further evidence for species-specific AhR regulons. Web: www.bch.msu.edu/~zacharet/ Email:kimsun5@msu.edu Supported by NIGMS R21 GM075838 TCDD INDUCES CYP1A1 mRNA IN HL1-1 CELLS A B Figure 3 QRT-PCR verification of CYP1A1 gene expression levels from the dose response (A) and time course (B) studies in HL1-1 cells treated with TCDD. Based on CYP1A1 induction levels, the EC50 for CYP1A1 expression was 8.30 nM. Error bars represent the SEM for the average fold change. * p < 0.05. MICROARRAY DATA: TIME COURSE Figure 4Number of genes exhibiting significant expression changes in the TCDD time course study. The number of active genes showed steady increase between 1 and 8 hr, followed by a decrease at 12 hr but further increases at 24 and 48 hr. MODEL COMPARISON OF CONSERVED EXPRESSION RESPONSES Figure 5 Hierarchical clustering of 273 active features expression profiles by gene and time in the TCDD time course study. Three time-dependent clusters were formed; early (2 and 4hrs), middle (8 and 12hrs), and late (24 and 48hrs). The early and middle time points show significant differences in their expression pattern, suggesting the characteristic differences in expression profiles between primary and secondary response genes. EXPERIMENTAL DESIGN QRT-PCR CONFIRMATION OF MICROARRAY DATA Figure 1HL1-1 TCDD time course, dose response and cycloheximide (CHX) co-treatment study designs. Time course study: HL1-1 cells were treated with either 10 nM TCDD or 0.1% DMSO and harvested at 1, 2, 4, 8, 12, 24, or 48 hrs post-treatment. Dose response study: HL1-1 cells were treated with 0.001, 0.01, 0.1, 1, 10, 100 nM TCDD or 0.1 % DMSO vehicle and harvested 12 hrs post-treatment (as indicated †). CHX co-treatment study: 10 mg/mL CHX was treated 1 hr precedent to 10 nM TCDD or 0.1% DMSO treatment. Each combination of treatment group was harvested at 4 and 12 hrs post-treatment (as indicated *). N=3 for each study. Figure 8:Comparative analysis of temporal gene expression profiles among human liver stem cell (HL1-1), human hepatoma cell line (HepG2), mouse hepatoma cell line (Hepa1c1c7) and hepatic tissue of C57BL/6 mice (Mm liver) studies. 251 active genes were identified from HL1-1 time course study, and 1,057, 770 and 1,465 active genes were identified from HepG2, Hepa1c1c7 and mouse liver, respectively. 75, 18 and 32 genes were identified as conserved between model systems compared with HL1-1 cell study. A. TIME COURSE DESIGN B. DOSE RESPONSE DESIGN Figure 2Microarray experimental designs for (A) time course, (B) dose response and (C) cycloheximide co-treatment study. (A) Temporal gene expression changes were analyzed using an independent reference design that results in two independent labeling of each sample. Numbers indicate time of cell harvesting (hours), T indicates TCDD treatment and V indicates DMSO vehicle treatment. (B) Dose response gene expression changes were analyzed using a spoke design. Each dose treatment sample was compared with independent vehicle control. (C) Cycloheximide co-treatment gene expression changes were analyzed using a 2x2 factorial design. This array design allows for multiple comparisons to identify significant changes in gene expression between treatments. Each arrow represents a single microarray where arrow heads represent Cy5-labeled samples and tails represent Cy3-labeled samples and double headed arrows indicate dye swap labeled on different arrays. C. CHX STUDY DESIGN Figure 6Quantitative real-time PCR (QRT-PCR) verification of microarray results in time course and dose response studies. Three putative primary TCDD-responsive genes (CYP1B1, ALDH1A3 and SLC7A5) were examined for microarray result verification. Fold changes were calculated relative to time-matched vehicle controls. Bar (left axis) and lines (right axis) represent QRT-PCR and cDNA microarray data, respectively. Results are represented as the average of three biological replicates. Error bars for QRT-PCR data represent the SEM for the average fold change. *p < 0.05 for QRT-PCR.


