Download
1 / 14
170 likes | 204 Vues
Learn about BCG matrix, a strategic tool by Boston Consulting Group to analyze business units, classify into quadrants, and make investment decisions, such as stars, cash cows, question marks, and dogs.

E N D
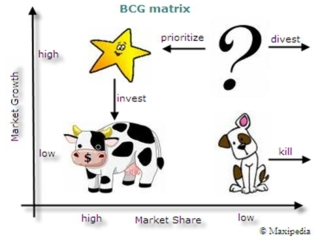
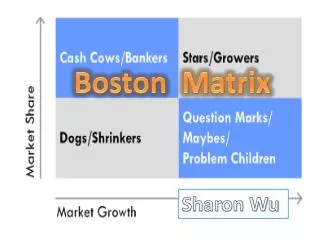
BCG Growth Share Matrix Devised as a portfolio planning tool, or corporate planning tool, the BCG growth-share matrix was first conceived by Bruce Henderson of the Boston Consulting Group back in the 1970's. The concept is based on four quadrants in which a company's business units (or products/brands) are classified. The quadrants are split into combinations of "market growth" and "market share", hence also being known as the growth-share matrix or growth-market-share matrix. The matrix is scored from low to high on both the x-axis and y-axis. The x-axis generally denotes the market growth rate, or cash usage - with the y-axis denoting relative market share, or cash generation.
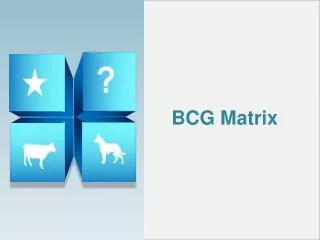
BCG Matrix Quadrants The BCG matrix is a framework to strategically measure the potential growth rate of a company within its industry versus its relative market share. By plotting these factors it is possible to identify which products (or brands/units) a company should invest further in, and which products it diversify away from. The matrix is split into categories known as: stars, question marks, cash cows and dogs. A BCG matrix will help develop a long-term strategic marketing plan to create more profitable products. High Cash Usage Low Low High CashGeneration
BCG Matrix Cash Cow Cash cow products deserve your attention. Cash cow brands (or products) are often well established, in constant demand, easy to produce and are therefore extremely profitable. As cash cow products do not require a lot of investment to maintain a high market share, every company should establish a cash cow to produce a reliable source of income. These cow products should be milked to produce cash. This can then be invested in "star" products to help establish them as the market leader and to generate higher ROI. BCG Matrix Rating Cash Usage – Low Cash Generation - High
BCG Matrix Star Star products are market leaders which generate the highest ROI than any other products. However, they do need continual investment to maintain market leader status. Stars are big cash generators and cash users. They shine in high growth markets. It is for this reason that companies should invest heavily in star products or brands. Successfully promoted star products will become cash cows. In the event that a star product is highly innovative, it may suffer from marketplace fluctuations ending up as a dog. BCG Matrix Rating Cash Usage – High Cash Generation - High
BCG Matrix Questions Question products are the hardest ones to determine if they will be successful or not. They often have a low market share and consume lots of cash and investment resources. With high levels of investment behind them, they have the opportunity to become Stars. Conversely, if they fail to gain traction in a fast high growth market, they will become dogs. Question mark products (brands/business units) can quickly become big loss makers and are often referred to as the "problem child". They need to be watched carefully. BCG Matrix Rating Cash Usage – High Cash Generation - Low
BCG Matrix Dogs Dog products or brands have low growth and low market share. These are not worth further investment as they will put a drain on resources for little improvement in market share. Whilst "Dogs" do not consume a lot of cash to produce or market, they also generate low returns. Meaning they can unnecessarily tie up time and cash with no long-term value. Unless these products complement or boost the performance of other products within a company's portfolio, then it is recommended to diversify away from "dog" products. BCG Matrix Rating Cash Usage – Low Cash Generation - Low
BCG Matrix FAQs The BCG matrix is used in marketing strategies to identify where to invest marketing budgets. It will help identify which products to promote to gain more market share. The matrix will highlight what products are considered dogs - therefore you should remove all marketing budget. The BCG matrix is used to evaluate a company's product portfolio, and can also assess strategic business units (SBUs) such as divisions or individual companies within larger organisations. Both market share and growth rate are plotted against quadrants categorised as Stars, Questions, Cash Cows and Dogs. What is the BCG matrix in marketing? What is the purpose of BCG matrix? What is the Boston matrix model? How do you use the BCG matrix? 05 To use the BCG matrix, a company will review its portfolio of products or SBUs, then allocate them to one of four quadrants based on their market share, growth rate, cash generation and cash usage. This is then used to determine which products receive investment, and which are diversified from. The Boston Matrix is a model which helps companies analyse their portfolio of products, brands or SBUs. The Boston Matrix is a planning tool used in marketing and business strategy. It helps decide which products to invest cash into and which to divert.
BCG Matrix In Marketing The BCG matrix can be used to visualise which marketing channels or platforms can help grow a company and the expected ROI per channel. There will be noticeable differences between B2B and B2C businesses and across industry sectors. The matrix below summarises our views on growth versus ROI. Banner Ads SEO Video PR High Facebook Outdoor Ads LinkedIn Growth by channel Google Ads Email Marketing Instagram Twitter Low TV Radio Low High Expected ROI from channel
BCG Matrix For Apple Based on various statistics and reports available on the Internet, the following example BCG matrix for Apple products looks like this: High Market Growth Rate (Cash Usage) Low Low High Market Share (Cash Generation)
BCG Matrix For Coca Cola Based on various statistics and reports available on the Internet, the following example BCG matrix for Coca Cola looks like this: High Market Growth Rate (Cash Usage) Low Low High Market Share (Cash Generation)
BCG Matrix For Samsung Based on various statistics and reports available on the Internet, the following example BCG matrix for Samsung products looks like this: High Market Growth Rate (Cash Usage) Low Low High Market Share (Cash Generation)
BCG Matrix For Nestle Based on various statistics and reports available on the Internet, the following example BCG matrix for Nestle produce looks like this: High Market Growth Rate (Cash Usage) Low Low High Market Share (Cash Generation)
CHECKLIST BCG Matrix Checklist Download a copy of BCG Matrix Identify your products or brands Analyse historical sales & growth data Compare your products to your competitors market share Assign your products to a quadrant and allocate investment accordingly