
Modeling X-ray Emission Line Profiles of Hot Stars: Insights from Z Pup and Other Cases
This paper presents a novel model for X-ray emission line profiles from hot stars, focusing on the case of Z Puppis (z Pup) observed by Chandra. By resolving emission lines in high-velocity stellar winds, we derive crucial kinematic information about the plasma. Our model features a spherically symmetric wind and accounts for continuum opacity effects, leading to a deeper understanding of hot star winds. We also explore observational data from other hot stars and the implications of various wind models on line profile shapes.

Modeling X-ray Emission Line Profiles of Hot Stars: Insights from Z Pup and Other Cases
E N D
Presentation Transcript
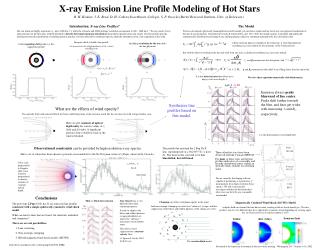
Zoom on final Initial after 2 days 2vinf/FWHMinst~ 20 Ne X • X-ray Emission Line Profile Modeling of Hot Stars • R. H. Kramer, J. E. Reed, D. H. Cohen (Swarthmore College), S. P. Owocki (Bartol Research Institute, Univ. of Delaware) Introduction: X-ray LineProfiles? Hot star winds are highly supersonic (v∞ up to 3000 km s-1), while the Chandra and XMM gratings’ resolution corresponds to 300 - 1000 km s-1. We can resolve X-ray emission lines for the first time, with the potential to directly determine kinematic information about the hot plasma in hot star winds. The line profiles provide information about the distribution of emitting material and also, for lines affected by continuum opacity, about the absorption of the cool component of the wind. The Model We have developed a physically meaningful line-profile model, yet one that is simple and not tied to any one proposed mechanism of hot-star X-ray production. Described in Owocki & Cohen (2001, ApJ, 559, 1108), the model assumes a smoothly and spherically symmetrically distributed accelerating X-ray emitting plasma subject to continuum attenuation by the cold stellar wind. Integrate shells to build a line profile. Can parameterize the radial dependencies of the velocity and filling factor. All the emission physics is hidden in the emissivity, h. Note that spherical coordinates (m,r) are natural for the symmetry of the wind emission. Including occultation by the star shifts the line blueward. A thin expanding shell produces a flat-topped line profile. But with the observer looking at the star and wind from one side, cyclindrical coordinates (p,z) are more natural. where andbparameterize the absorption. And for q and Ro parameterize the radial X-ray filling factor, thus the emissivity. It is this delta function that allows us to map m,r into wavelength, l. We solve these equations numerically with Mathematica. t*=1, 3 ,5, 10 Emission always peaks blueward of line center. Peaks shift farther towards the blue, and lines get wider, with increasing * and R0 , respectively. Synthesize line profiles based on this model. What are the effects of wind opacity? The optically thick cold wind will block the back, redshifted portion of the emission, much like the star does, but with a larger shadow cone. .Here we plot contours ofoptical depth unity for various values of * (left) and (right). A significant portion of the redshifted, back of the wind is blocked Ro x is the dimensionless wavelength shift Observational constraints can be provided by high-resolution x-ray spectra. Here a set of values has been chosen to provide a reasonable fit to the Ne X Lyman-a line of z Pupis, observed by Chandra. The profile that matched the z Pup Ne X line, superimposed on z Ori (O9.5 I)--a poor fit. The lines in this star tend to be less blueshifted, but still broad. d Ori O9.5 II Three other hot stars have been observed with the Chandra HETGS For none of these stars are the line profiles indicative of a smoothly and broadly distributed source within an optically thick, radially accelerating wind. Color scale proportional to Doppler shift; color intensity proportional to density; contours of constant optical depth. q1 Ori C O7.5 V line blend We are currently developing software capable of performing a 4-parameter, 2 minimization fit on high-resolution X-ray spectra. We will systematically investigate whether the data from these other stars can be fit by any reasonable wind model. t Sco B0 V • Conclusions • The prototype z Pup (O4 I) has X-ray emission line profiles consistent with a simple spherically symmetric wind shock model. • What can lead to lines that are broad, but relatively unshifted and symmetric? • There are several possibilities: • 1. Line scattering • 2. Non-isotropic clumping • 3. Hybrid magnetic/wind-shock models (MCWS) Thin vs. Thick line-emission Line Opacity has a very different effect than continuum opacity. It tends to suppress the bluest and reddest photons; escape probabilities are largest for “sideways” trajectories out of Sobolev zones. This effect is most significant for a constant-velocity flow. cf. Ignace & Gayley 2001 for b=0 case Clumping can reduce continuum opacity in the wind. And non-isotropic clumping can also favor “sideways” escape, and thus suppression of the bluest and reddest photons, if the clumps are oblate. Magnetically Confined Wind Shock (MCWS) Model A dipole field can channel the line-driven wind, creating a disk of shock-heated gas. The line profiles may be very different than for a spherically symmetric wind, depending on viewing angle. See ud-Doula and Owocki’s poster number 135.07. The venetian blind model http://hven.swarthmore.edu/~cohen/group/AAS2002_RHK/ Presented at the American Astronomical Society winter meeting - Washington, DC - January 6-10, 2002


