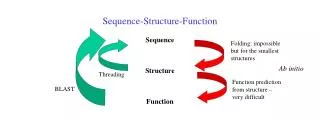
Structure vs Function
Explore the use of functional neuroimaging in pediatric brain development disorders like autism. Discussing sedation methods, 1H MRS insights, and volumetric analysis with a focus on MRSA applications.

Structure vs Function
E N D
Presentation Transcript
Pediatric Applications of MRSA Trans-NIH Workshop on Pediatric Functional NeuroimagingStephen R Dager, MDDepartment of RadiologyUniversity of Washington
Outline of Talk1. Methodological considerations- to sedate or not to sedate? 2. What can 1H MRS inform us about brain development gone awry? 3. Beyond 1H MRS- a brief overview of 19F pediatric applications.
Structure vs Function 3 yr old control
MRI Subject Characteristics at Age 3 (N=88) Group ASD Autism TD Control DD Control N 45 26* 17 Gender 7f 8f 9f Age (±SD) 47.4±4.2 mo 47.5±6.2 mo 46.3±6.2 mo Range (mo) 38-56 37-56 37-59 *NIH=13 (5f) UW=13 (3f)
MRI Subject Characteristics at Age 6 (N=67) Group ASD Autism TD Control DD Control N 33 20 14 Gender 7f 8f 5f Age (±SD) 78.8±4.7 mo 78.5±5.1 mo 76.5±4.2 mo Range (mo) 73-88 72-94 71-88
MRI Methods/Analysis • MR Acquisition • GE Signa 1.5 T • Custom (home-built) pediatric linear birdcage coil • 3D coronal SPGR (22 FOV, 1.5mm slices), 256x192 • Proton density/T2-weighted 2D axials (22 FOV, 2.5mm slices) • 2D- Proton Echo Planar Spectroscopic Imaging- 2 levels • (20/272 msec TE, TR= 2sec, 32 X 32 spatial matrix) • Approximately 2 hour studies- propofol anesthesia
Sedation Methods • Normal Sleep Studies • prestudy training • 50+ % failure rate for typical developing children • children awaken in scanner • Sedative-Hypnotics • NPO • idiosyncratic reactions • variable time course for maintaining sedation • prolonged recovery time (irritability) • PropofolNPO • IV administration • anesthesiologist required onsite • safety concerns???
MRI Volumetric Analysis • Volumetric Analyses • Rater blind to Dx using MEASURE (Johns Hopkins University) • Total Brain-3 dimensional stereotaxic grid • Hippocampus, Amygdala - Manual tracing - Honeycutt 1998, Aylward 1999 • Statistics • ANCOVA used for all analyses (covaried age & gender [+brain]) • Raw data displayed as Mean±SD • Transformed to Z-scores±SD for plots (vs TD controls)
1300 1200 1100 1000 900 Cerebral Volume by Group- Age 3 p=.004 p=.001 Volume (cc3 ±SD) ASD Autism (N=45) TD Control (N=26) DD Control (N=14) (Sparkset al. Neurology 2002)
Summary- Age 3 • Increased cerebral volume and substructures in childhood ASD • Both boys and girls had volume increased cerebral volume • Substructure findings less consistent for girls • Substructures proportionally increased when scaled for cerebral volume • The AD subgroup (more severely affected) demonstrated disproportionately increased bilateral amygdalar volumes. • Consistent results found evaluating AD vs PDD boys • Marked structural differences between DD and ASD/ TD children Sparks et al. Neurology 2002
Advantages of MRS • Tissue Based • Quantitative • Allows multiple chemicals to be assayed simultaneously • Assess both structural and dynamic abnormalities • Contrast remains when blood flow is reduced
Human Studies: 1H Single Voxel Spectroscopy N-Acetyl Aspartate (NAA) Creatine (Cre) Choline (Cho) mI Glx lip/mac ppm 4.0 3.0 2.0 1.0 MRI MRS (20ms)
2-D PEPSI-Brain Metabolites NAA Cho Cre 3 year old-Autistic Child
Slice locations for 2-D PEPSI a b a b 4 yr old-Autistic TE=272ms/TR=2000 TE=30ms/TR=2000
MRS Subject Characteristics- age 3 (N=71) Group ASD Autism TD Control DD Control N 45† 12†* 14† Gender 7f 2f 8f Age (±SD) 47.4±4.22 mo 46.6±4.53 mo 47.46±5.84 mo Range (mo) 38-54 33-56 40-58 Study propofol Sleep propofol * benadryl=6 †45/9/12 *failures=15/27
PEPSI Methods • MRSI Acquisition • GE Signa 1.5 T using a receive-only birdcage • PEPSI (TE=20/272, 32x32, 1cm3, TR=2s, 22 FOV) • 20ms - 4 min; 272ms - 8 min, metabolites and water • Two 20mm slabs: temporal lobes; basal ganglia • SI Processing • Software written in Fortran, MATLAB, using LCModel • Automated run employing PEPSI phantom libraries • Odd/even datasets fit separately, maps generated • Data masked by fit confidence (%SD) • Quantification: • Corrected for R1/R2/TG, referenced to brain water corrected for %tissue
Background • Spectroscopy • We initially predicted that larger brains would be associated with increased neuronal packing density • By MRS, we had expected: • neurochemical concentrations • metabolite relaxation times
T2 T2 272ms 272ms Original Cellular Model Neuron Glial Cell Control Autism MRS [Conc] 20ms 20ms
Combined Regions: Summary Cre - - Cre - NAA - NAA - Cho - - - Cho - - T2 CONC Ins - Lac - - - Group ASD-TD ASD-DD† DD-TD Brain - † propofol comparison groups p<.05 p<.1 (Friedmanet al. Neurology 2003)
Regional MRS Summary • In contrast to hypotheses of widespread densely packed neurons resulting from abnormal developmental processes, inverse relationships were demonstrated • neurochemical concentrations • metabolite relaxation times • Alternative models in ASD for disordered cellular organization, distribution, or cytoarchitecture (Friedmanet al. Neurology 2003)
MRI Segmentation MRI (N3) CLASSIFIED
Discussion • Tissue Specificity • GMis the primary compartment demonstrating MRS alterations • Regional white matter alterations also present (lobular) • Future Model Components • Cell density regional increases and decreases (size?) • Glial subtype changes, gliosis • Disorganization of cortical columns • Normal variation: How much do cell size, distribution (neurons/glia), terminal density, and packing ratio (intra/extracellular fractions) differ with increasing brain size?
Summary • ASD cerebral enlargement at age 3 no longer apparent by age 6 Amygdalar enlargement accentuated at age 6: AD> ASD • Hippocampi and cerebellum not different between ASD and TD children. ASD> DD <TD Children • Chemicals [ ]’s reduced and T2 relaxation prolonged (age 3) • Longitudinal growth analyses pending • Analyses of chemical measures at age 6 pending • Behavioral/prognostic relationships
Long-Term Goals • Longitudinal follow-up is investigating evolution of brain morphological and chemical measures between 3 - 9 years of age • Links between brain structural/chemical abnormalities and prognosis/longitudinal progression of symptom expression are under investigation • To assess whether quantification of tissue chemical composition can aid in characterizing the cellular environment underlying structural development.
19F MRS • Many psychotropic drugs have 19F incorporated into structure • Modeling brain pharmacokinetics • Brain uptake • Steady state brain concentration • Volume of distribution • Drug binding (magnetization transfer) • Brain elimination T1/2
19F MRS Methods • 21 pediatric subjects (AD/PDD)- 16 successfully completed study • Open label medications- consistent dose > 1 month • Children: fluoxetine (n=8; 8.8 + 3.7 years sd) • fluvoxamine (n=8; 11.8 + 3.2 years sd) • Adults: fluoxetine (n=15; 51.9 + 11.3 years sd) • fluvoxamine (n=13; 44.8 + 17.5 years sd) • Elimination T1/2 for 2 children discontinued from fluoxetine • Whole brain drug [ ] determined using a GE Signa 1.5T • Home built 19F quadrature birdcage headcoil • drug [ ] determined relative to NaF phantom at each session
Fluoxetine Brain Concentration- Age Relationships Strauss et al. Am Jr Psych 2002
Fluvoxamine Brain Concentration- Age Relationships Strauss et al. Am Jr Psych 2002
19F MRS Summary • Significant relationships between dose and brain drug levels • Brain levels approx 20-fold higher than plasma levels • Brain fluoxetine levels similar between age groups • Brain fluvoxamine levels lower in children- ? sedation SE profile • Adjusted for dose/body mass, age effects not significant • Observations of brain fluoxetine bioavailability and elimination half-life (> 16 days) similar between age groups • More efficient hepatic clearance in children- • Brain drug levels relatively invisible to liver vs plasma levels
Key Personnel Collaborators: Seth Friedman, PhD Dennis Shaw, MD Jeff Munson, PhD Sarah Webb, PhD Alan Artru, MD Bobbi Sparks, BS Todd Richards, PhD Kenneth Maravilla, MD Jill Gardner, PhD Cecil Hayes, PhD Geri Dawson, PhD Radiology Radiology Psychology Psychology Anesthesiology Radiology Radiology Radiology Radiology Radiology Psychology Jay Giedd, MD Stefan Posse, PhD Supported by: NICHD (PO1- HD34565) NAAR Neuropharmacology Fellowship University of Washington Wayne Strauss, MD PhD Bioengineering
Acknowledgments We gratefully acknowledge support from the NICHD (PO1- HD34565). We wish also to extend our thanks to the parents and children who participated in this study.