Download
1 / 97
990 likes | 1.26k Vues
Introduction to SIX - SIGMA. Presented by : http://www.QualityGurus.com. Agenda. Participants Introduction. Your Name Department Your job profile Your exposure to Quality Management/ Six Sigma. Ground Rules. Program success depends on your participation. Actively participate.

E N D
Introduction toSIX - SIGMA Presented by : http://www.QualityGurus.com
Participants Introduction • Your Name • Department • Your job profile • Your exposure to Quality Management/ Six Sigma
Ground Rules • Program success depends on your participation. Actively participate. • Please avoid cross-talks. • Observe specified timings. • Please keep your mobile phones switched off. • Feel free to ask question at any point of time. - Restrict question to specific issue being discussed, while general questions can be discussed during Q & A session. • Enjoy the program !
Introduction to Six Sigma Purpose of six sigma : To make customer happier and increase profits
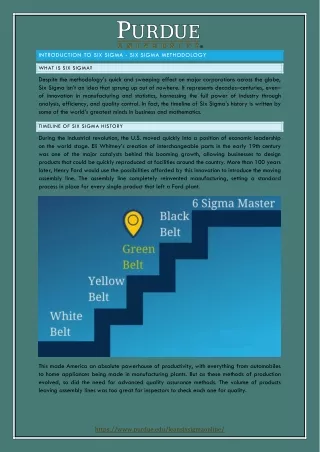
Origin of Six Sigma • 1987 Motorola Develops Six Sigma • Raised Quality Standards • Other Companies Adopt Six Sigma • GE • Promotions, Profit Sharing (Stock Options), etc. directly tied to Six Sigma training. • Dow Chemical, DuPont, Honeywell, Whirlpool
Time Line Allied Signal Johnson & Johnson, Ford, Nissan, Honeywell Motorola General Electric 1985 1987 1992 1995 2002 Dr Mikel J Harry wrote a Paper relating early failures to quality
Width of landing strip 1/2 Width of landing strip If pilot always lands within 1/2 the landing strip width, we say that he has Six-sigma capability. Pilot’s Six-Sigma Performance
Current Leadership Challenges • Delighting Customers. • Reducing Cycle Times. • Keeping up with Technology Advances. • Retaining People. • Reducing Costs. • Responding More Quickly. • Structuring for Flexibility. • Growing Overseas Markets.
Six Sigma— Benefits? • Generated sustained success • Project selection tied to organizational strategy • Customer focused • Profits • Project outcomes / benefits tied to financial reporting system. • Full-time Black Belts in a rigorous, project-oriented method. • Recognition and reward system established to provide motivation.
Management involvement? • Executives and upper management drive the effort through: • Understanding Six Sigma • Significant financial commitments • Actively selecting projects tied to strategy • Setting up formal review process • Selecting Champions • Determining strategic measures
Management Involvement? • Key issues for Leadership: • How will leadership organize to support Six Sigma ? (6 council, Director 6 , etc) • Transition rate to achieve 6 . • Level of resource commitment. • Centralized or decentralized approach. • Integration with current initiatives e.g. QMS • How will the progress be monitored?
What can it do? Motorola: • 5-Fold growth in Sales • Profits climbing by 20% pa • Cumulative savings of $14 billion over 11 years General Electric: • $2 billion savings in just 3 years • The no.1 company in the USA Bechtel Corporation: • $200 million savings with investment of $30 million
(in millions) 2500 2000 1500 Cost 1000 Benefit 500 0 1996 1996 1998 2000 2002 GE Six Sigma Economics 6 Sigma Project Progress Source: 1998 GE Annual Report, Jack Welch Letter to Share Owners and Employees - progress based upon total corporation cost/benefits attributable to Six Sigma.
CHANGE THE WORLD 6 SIGMA AS A PHILOSOPHY TRANSFORM THE ORGANIZATION 6 SIGMA AS A PROCESS GROWTH COSTS OUT 6 SIGMA AS A STATISTICAL TOOL PAIN, URGENCY, SURVIVAL Overview of Six Sigma
Overview of Six Sigma It is a Process • To achieve this level of performance you need to: Define, Measure, Analyse, Improve and Control It is a Philosophy • Anything less than ideal is an opportunity for improvement • Defects costs money • Understanding processes and improving them is the most efficient way to achieve lasting results It is Statistics • 6 Sigma processes will produce less than 3.4 defects per million opportunities
Philosophy Know What’s Important to the Customer (CTQ) Reduce Defects (DPMO) Center Around Target (Mean) Reduce Variation (Standard Deviation)
Critical Elements • Genuine Focus on the Customer • Data and Fact Driven Management • Process Focus • Proactive management • Boundary-less Collaboration • Drive for Perfection; Tolerance for failure
Data Driven Decision f(X) Y= • Y • Dependent • Output • Effect • Symptom • Monitor • X1 . . . Xn • Independent • Input-Process • Cause • Problem • Control The focus of Six sigma is to identify and control Xs
Two Processes DMAIC DMADV • Existing Processes • New Processes • DFSS • Define • Measure • Analyze • Improve • Control • Define • Measure • Analyze • Design • Verify
COPQ (Cost of Poor Quality) - Inspection - Warranty - Scrap - Rework - Rejects • Traditional Quality Costs: • Tangible • Easy to Measure - More Setups - Expediting Costs - Lost Sales - Late Delivery - Lost Customer Loyalty - Excess Inventory - Long Cycle Times - Costly Engineering Changes • Hidden Costs: • Intangible • Difficult to Measure - Lost Opportunities - The Hidden Factory Average COPQ approximately 15% of Sales
COPQ v/s Sigma Level Cost of Quality % Sales Sigma Level
CTQ (Critical-To-Quality) • CTQ characteristics for the process, service or process • Measure of “What is important to Customer” • 6 Sigma projects are designed to improve CTQ • Examples: • Waiting time in clinic • Spelling mistakes in letter • % of valves leaking in operation
Defective and Defect • A nonconforming unit is a defective unit • Defect is nonconformance on one of many possible quality characteristics of a unit that causes customer dissatisfaction. • A defect does not necessarily make the unit defective • Examples: • Scratch on water bottle • (However if customer wants a scratch free bottle, then this will be defective bottle)
Defect Opportunity • Circumstances in which CTQ can fail to meet. • Number of defect opportunities relate to complexity of unit. • Complex units – Greater opportunities of defect than simple units • Examples: • A units has 5 parts, and in each part there are 3 opportunities of defects – Total defect opportunities are 5 x 3 = 15
DPO (Defect Per Opportunity) • Number of defects divided by number of defect opportunities • Examples: • In previous case (15 defect opportunities), if 10 units have 2 defects. • Defects per unit = 2 / 10 = 0.2 • DPO = 2 / (15 x 10) = 0.0133333
DPMO (Defect Per Million Opportunities) • DPO multiplies by one million • Examples: • In previous case (15 defect opportunities), if 10 units have 2 defects. • Defects per unit = 2 / 10 = 0.2 • DPO = 2 / (15 x 10) = 0.0133333 • DPMO = 0.013333333 x 1,000,000 = 13,333 Six Sigma performance is 3.4 DPMO 13,333 DPMO is 3.7 Sigma
Yield • Proportion of units within specification divided by the total number of units. • Examples: • If 10 units have 2 defectives • Yield = (10 – 2) x 100 /10 = 80 % • Rolled Through Yield (RTY) • Y1 x Y2 x Y3 x ……. x Yn • E.g 0.90 x 0.99 x 0.76 x 0.80 = 0.54
What are the forms of waste? • Waste of Correction • Waste of Overproduction • Waste of processing • Waste of conveyance (or transport) • Waste of inventory • Waste of motion • Waste of waiting
1. Waste of correction • Repairing a defect wastes time and resources (Hidden factory) Hidden Factory Rework Rework Failure Investigation Failure Investigation Product Operation 1 Test Operation 2 Test
2. Waste of Overproduction • Producing more than necessary or producing at faster rate than required • Excess labor, space, money, handling
3. Waste of processing • Processing that does not provide value to the product • Excess level of approvals • Tying memos that could be handwritten • Cosmetic painting on internals of equipment • Paint thickness more than specific values
4. Waste of conveyance • Unnecessary movement of material from one place to other to be minimized because - • It adds to process time • Goods might get damaged • Convey material and information ONLY when and where it is needed.
5. Waste of inventory • Any excess inventory is drain on an organization. • Impact on cash flow • Increased overheads • Covers Quality and process issues • Examples • Spares, brochures, stationary, …
6. Waste of Motion • Any movement of people, equipment, information that does not contribute value to product or service
7. Waste of Waiting • Idle time between operations • Period of inactivity in a downstream process because an upstream activity does not deliver on time. • Downstream resources are then often used in activities that do not add value, or worst result in overproduction.
Some more sources of Waste • Waste of untapped human potential. • Waste of inappropriate systems • Wasted energy and water • Wasted materials • Waste of customer time • Waste of defecting customers
Have you ever… • Shot a rifle? • Played darts? What is the point of these sports? What makes them hard?
Jack Jill Have you ever… • Shot a rifle? • Played darts? Who is the better shooter?
8 7 10 8 9 Jack Jill Variability • Deviation = distance between observations and the mean (or average)
Jack 7 6 7 7 6 Jill Variability • Deviation = distance between observations and the mean (or average)
8 7 10 8 9 Jack Jill Variability • Variance = average distance between observations and the mean squared Variance
Jack 7 6 7 7 6 Jill Variability • Variance = average distance between observations and the mean squared Variance
? But what good is a standard deviation Variability • Standard deviation = square root of variance Jack Jill
Even very rare outcomes are possible Even very rare outcomes are possible Fewer in the “tails” (upper) Fewer in the “tails” (lower) Most outcomes occur in the middle Variability The world tends to be bell-shaped
Variability Here is why: Even outcomes that are equally likely (like dice), when you add them up, become bell shaped
“Normal” bell shaped curve Normal distributions are divide up into 3 standard deviations on each side of the mean Once your that, you know a lot about what is going on ? And that is what a standard deviation is good for