Software Performance Engineering Failure Modes and Effects Analysis
Software Performance Engineering Failure Modes and Effects Analysis. Presented by Kevin Mobley. SPE FMEA Agenda. Definition What is the problem solved with a SPE FMEA SPE FMEA anatomy Risk: anti-pattern assessment Likelihood of occurrence: frequency analysis

Software Performance Engineering Failure Modes and Effects Analysis
E N D
Presentation Transcript
Software Performance Engineering Failure Modes and Effects Analysis Presented by Kevin Mobley
SPE FMEA Agenda • Definition • What is the problem solved with a SPE FMEA • SPE FMEA anatomy • Risk: anti-pattern assessment • Likelihood of occurrence: frequency analysis • Voice of the customer: willingness to wait • Detection: control plan • SPE FMEA life cycle with examples • SPE FMEA perquisites and tools
Modeling Problem/Goal/Scope Problem – In order to simulate the day to day and peak day operations of an application, an accurate identification of the most critical business process is required Goal – Define the top 20% business processes that create 80% of the server requests, as well as outlier business processes that are severe performance risks In Scope – Definition of business processes, Anti-Pattern analysis, business frequency, willingness to wait and detection review Resource Plan • Business Analyst • Development Architect and Leads • Performance Architects Business Case • Ensures performance engineering focuses on the most critical user activity that will impact the application and system performance • Sources of Financial Benefits: Ensures investment in performance delivers the operational readiness of application • First Year Annualized Benefits: Establishes a traceable and defensible methodology of how and why business processes were and were not included in the performance engineering effort. The confidence in this BP set will be tested during the first year of production Milestones • Gather the business processes used currently by client(s) • Rank anti-patterns for each business process • Analyze historical business process usage • Complete willingness to wait with client (implementations only) • Complete detection section • Review business process selection with stakeholders • Sign off on business processes
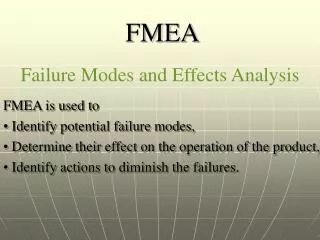
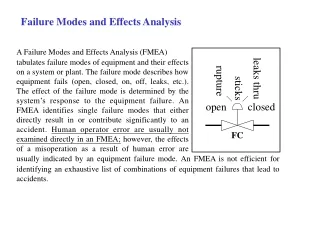
SPE FMEA is a structured approach • Identifies ways in which software can fail to meet critical performance requirements (response time, CPU and network utilization, etc.) • Estimates the risk of an unanticipated performance failure • Evaluates the current control plan for identifying and/or preventing these performance failures from occurring • Prioritizes actions that should be taken to improve the software
SPE FMEA Anatomy • Risk: Anti-Pattern Assessment • Likelihood of Occurrence: Frequency Analysis • Voice of the Customer: Willingness to Wait • Detection: Control Plan
SPE FMEA Life Cycle • SPE FMEA during the design phase • SPE FMEA during software development • SPE FMEA during performance testing and optimization • SPE FMEA during production
SPE FMEA During Design • Guessing is okay as long as the process is structured and consistent • Review code and interview application developers to complete risk section • Survey clients and product management for frequency data • Advantages • Huge opportunity for redesign with smaller software budget impact • Localize the concept of performance into architecture design and coding decisions • Establish early how the non-functional requirements will be assessed • Challenges • Stakeholders have lower confidence in SPE FMEA • High resistance by developers because most have never thought of the Anti-patterns during design • Non-functional requirements are not standard in software development
Risk Example • Message size is 24 kb – Risk Rank is 5 • Content to Message Ratio is 11.2% -- Risk Rank is 10 • A snippet of XML Message <InterestDueFromClosingAmount>0.00</InterestDueFromClosingAmount> <DailySimpleInterestOverdueInterestAmount>0.00</DailySimpleInterestOverdueInterestAmount> <PiggybackPrincipalBalance>0.00</PiggybackPrincipalBalance> <BuydownSubsidyRemainingBalance>0.00</BuydownSubsidyRemainingBalance> <AccruedLateChargeBalance>0.00</AccruedLateChargeBalance> <RuleOf78sUnearnedInterestUnpaidBalance>0.00</RuleOf78sUnearnedInterestUnpaidBalance> <RuleOf78sOriginalUnearnedInterestDueBalance>0.00</RuleOf78sOriginalUnearnedInterestDueBalance>
SPE FMEA During Development • Measure data values for anti-patterns • Make code changes • Each developer delivers an Anti-Pattern spec sheets with checked in code • Advantages • Greatest breath of analysis of software code • Product SPE FMEA is more comprehensive with each release • Challenges • Architecture changes are harder • Impact to software budget increases
Risk Example • We wrote a bridge parse tool Message Name: SMValidateUser (REQUEST) Total Tags: 5 Total Empty Tags: 0 Content/Message Size Ratio: 15.13% Empty Tag/Total Tag Ratio: 0.00%
SPE FMEA During Performance Testing and Optimization • Demonstrate correlation between Anti-patterns and performance metrics • Key driver for focus of the testing and optimization effort • Advantages • High risk areas are focus of performance testing and optimization, assuring the performance of most important business processes • Creates a paper trail of why certain business process were focused on and others were left out • Forces a review of performance monitoring solution to determine if adequate and timely detection of poor performance with second and third tier business processes is in place • Statistical analysis between performance and anti-patterns is available • Challenges • Early generations of an application SPE FMEA will be less accurate, causing some business processes to be improperly categorized • Anti-pattern weights may require adjusting
Risk Example • Relationship between response size and response time One-way ANOVA: Time versus Response Size S = 2243 R-Sq = 38.24% R-Sq(adj) = 36.96%
SPE FMEA Perquisites and Tools • Develop application anti-patterns • Put system under load • Create a cause and effect model • Assign initial risk values • Collect and maintain usage data from clients • Create parse tools to use during unit and performance testing
Thank You Kevin Mobley kevin.mobley@gmail.com kevin.mobley@fnf.com