Download

1 / 14
140 likes | 319 Vues
Use this cover page for external presentations. Client logo should go no higher than this guide. Managing Risk, Capital and Value. Client logo should be aligned bottom with this guide. Date should be aligned top with this guide. July 30, 2003. Title should be aligned top with this guide.

E N D
Use this cover page for external presentations Client logo should go no higher than this guide Managing Risk, Capital and Value Client logo should be aligned bottom with this guide Date shouldbe aligned topwith this guide July 30, 2003 Title shouldbe aligned topwith this guide Stuart Wason, FSA, FCIA, MAAA
Insurer Risk Control Cycle Business Environment Solvency Risks Design Profit Capital Pricing Experience Liabilities A/L Mgt Assets Professionalism
Risk-Based Performance Metrics Are Critical Inputs to Management Decision-Making Processes Business Unit Performance Measurement and Incentive Compensation CapitalAdequacy and Rating Agency/Analyst Communication Corporate Resource Allocation Robust View of Risk and Returns Strategic Asset Allocation/ALM Corporate Risk Management Risk-Adjusted Pricing and Customer Profitability Management “In our view, the sign of a sophisticated management team is a focus on value-added returns and return on risk-adjusted capital (RAROC).”– Morgan Stanley equity analyst
Most Sectors of Financial Services Have Adopted or Are Contemplating Adoption of an Economic Capital And RAROC Measurement Framework
What do shareholders require for risk? What is the return on shareholders’ capital? Where is capital attributed? What is the business worth? BUSINESS UNIT ECONOMIC CAPITAL RAROC HURDLE GROWTH INTRINSIC VALUE Business Unit A $1.3 BN 35% 15% 5% $3.9 BN Business Unit B $1.8 BN 10% 15% 7% $0.7 BN Business Unit C $0.9 BN 15% 15% 8% $0.9 BN How much capital is needed? Business Unit D $0.5 BN 40% 15% 6% $1.9 BN 21% $7.4 BN Total Economic Capital $4.5 BN Excess Capital Total Available Capital $0.5 BN $5.0 BN 7% 20% 15% 0% $0.2 BN How does excess capital affect value? $7.6 BN RAROC and Economic Capital are Key Components to Business Unit Performance Measurement and Capital Management
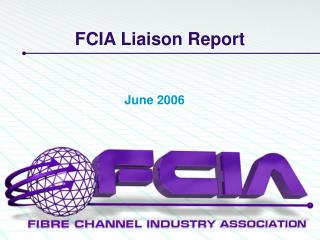
RAROC 60% Broker Dealer Money Manager 1 50% COLI/BOLI 40% Disability – 30% Open Annuities Life 20% DB Hurdle Rate Money Manager 2 DC 10% Other Investment Services Disability – Closed 0% 0% 25% 50% 75% 100% RAROC is an Important Element in Determining Corporate Resource Allocation . . . Feed/starve Chart for a US Life Insurer Above Hurdle Businesses • Identify opportunities to grow organically • Acquire businesses where market value is less than intrinsic value Below Hurdle Businesses • Explore opportunities to increase returns • Risk-taking • Pricing • Costs • Shrink to profitable core • Exit Cumulative Percent of Utilized Capital
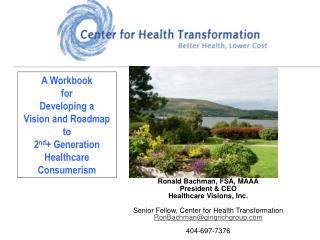
Fixed Annuities Auto 50% Individual Life 40% Disability 30% Broker/ Dealer Homeowners 20% ExcessCapital Variable Annuities 10% 0% 0% 20% 40% 60% 80% 100% . . . While More Sophisticated Frameworks Take Prospective Views of Value Creation Linking Financial and Strategic Planning Intrinsic Value Added (% of Capital) This is where we would put any important information specific to this particular document or page, i.e. special colors or formats Business Line RAROC and EconomicCapital Strategic Plan CorporateVision • BU missions • Growth and performance targets, including optimization potential • Corporate M&A • Capital plan MarketAttractiveness Cumulative Capital CompetitivePositioning ExcessCapital Economic Capital Iterate as Desired
SOLVENCY STANDARD A AA AAA Expected Loss (EL) KA KAA Capital Required to Achieve Rating KAAA Definition of Economic Capital: A Common Currency for Risks Across Businesses; The Anchor is Your Target Solvency Standard (Credit Rating) • Economic capital is the capital required to buffer the policyholder from default up to a target solvency standard (and thus confidence interval) • For the same risk profile, an institution targeting a better credit rating will need to hold more capital (AA institutions require more capital than single A) • The confidence interval for the company should be linked to credit rating and anchored to observable financial instruments (e.g. bonds)
Economic Capital DeterminationKey ingredients • Time horizon • Need to recognize full duration of business • Need to ensure solvency over a suitable supervisory control horizon such as one or two years • Key elements of risk • Systematic risk arises from uncertainty risk (i.e., model specification error, parameter estimation error, structural risk error) andextreme event risk (i.e., high impact one-time shocks, events which may be completely unanticipated and not captured in model) • Uncertainty risk is generally considered to be non-diversifiable • Non-systematic risk (also called volatility risk or process risk) represents random fluctuations in experience and is considered to be diversifiable • Confidence level • Depends on time horizon • Depends on ratings level target
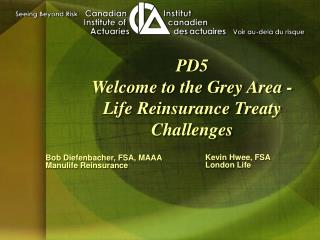
Economic Capital is Calculated By Considering the Distributions of All Sources of Risk and The Correlations Between Them RISK 1. Identify all sources of risk Asset Risk Operational Risk Credit Risk Market Risk Insurance Risk ALM Risk Business Risk Event Risk 2. Characterize the distributions 3. Combine distributions Correlations, Dependencies SolvencyStandard EL 5. Calculate contributions of business lines and individual risks 4. Measure required capital Economic Capital
The Relative Magnitude and Measurement ‘State of the Art’ Suggest Differing Development Priorities Across Risks Comments • Credit: developed but needing refinement • Most insurers have risk ratings, capital charges and credit monitoring • Increasing appetite for credit risk, variety of credit risk classes and competition requires increased sophistication especially in risk grading, portfolio management tools and early warning • Market: less developed but less critical • Small size of equity portfolios and buy and hold approach makes advanced measurement less critical • Exception is market exposure within variable products • Mortality and morbidity: strong understanding of ‘mean’, need to better measure ‘volatility’ • Actuarial processes focus on determining expected losses, not volatility • As portfolios shift to more protection-oriented product (especially disability and immediate annuities), more accurate measurement will be needed • ALM risk: strong effort and infrastructure, needs more discipline • Heavy focus of actuaries based upon statutory accounting and regulatory reporting • Needs to be tied to probabilistic scenarios, valued at ‘market’ discount rates and tied to pricing • Business/operational risk: historically not a focus, managing risk is key • Operational risk not a historical focus due to the difficulty of quantifying risk – new techniques (using internal and external data) are improving operational risk measurement; experience has shown that monitoring and reporting of operating events reduces incidence • Business (especially lapse) risk quantification is increasingly important especially for annuities Typical Risk CompositionOf A Life Insurer
Risk Adjusted ReturnKey ingredients • Gross return • Should return reflect a short or a long term view of the business? • Should return be based on GAAP reporting basis? (Ignores changes in long term value such as EC) • Should return reflect changes to EC? (Need to allow for correlation and diversification of risks between lines of business) • Less cost of capital • After tax adjustment to reflect cost of capital employed • Perhaps 3-4% of economic capital • Equals risk adjusted return
Managing Risk, Capital and ValueKey messages • Risk is inherent in all aspects of an insurer’s operations • Capital is vital to the operations of an insurer • Capital allocation and RAROC are useful tools in managing risk, capital & value • Carefully choose appropriate measures for numerator and denominator of RAROC • Capital considerations (time horizon; elements of risk; confidence level etc.) • Risk adjusted return considerations (short vs long term view; allow for cost of capital) • No matter how sophisticated the allocation of capital, all of the capital of the company stands behind all of its risks!
Use this cover page for external presentations Client logo should go no higher than this guide Managing Risk, Capital and Value Client logo should be aligned bottom with this guide Date shouldbe aligned topwith this guide July 30, 2003 Title shouldbe aligned topwith this guide Thank you! My email address is swason@mow.com