Download
1 / 64
640 likes | 813 Vues
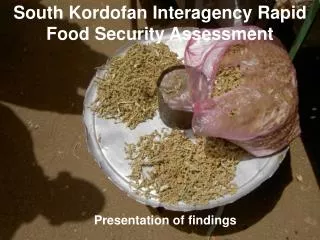
South Kordofan Interagency Rapid Food Security Assessment. Presentation of findings. Structure of the presentation. Assessment process General findings Who and how many are food insecure (and secure)? Where are the food insecure? Response options and recommendations.

E N D
South Kordofan Interagency Rapid Food Security Assessment Presentation of findings
Structure of the presentation • Assessment process • General findings • Who and how many are food insecure (and secure)? • Where are the food insecure? • Response options and recommendations
Sampling and methodology • Assessing food security of flood affected communities in South Kordofan • Flood impact: 34 communities (176, 881 persons) • Sampling universe reduced to 21 communities (84,761 persons) due to insecurity • Two stage random sampling (15 clusters and 20 households per cluster) • Total sample 300 households • Household and community questionnaires plus focus group discussions
Assessment process • Questionnaire design in Khartoum • Training of team leaders and enumerators in Kadugli • Two field teams • Two weeks of field work between 5 – 16 March • Data entry in Kadugli • Data analysis in Khartoum (quantitative and qualitative) • Presentation of findings in Kadugli and Khartoum
Participating Agencies and Authorities • WFP • HAC-SRRC • FAO • Norwegian Refugee Council • Save the Children US • Care International • State Ministry of Agriculture • SAAR • State Ministry of Health • RRR
Prices and terms of trade • Average cereal prices • Cereal prices rose by 76% for sorghum and 47% for millet compared last year • Average livestock prices • Livestock prices dropped by 31% for cattle and 37% for sheep and goats compared to last year • Terms of Trade • Terms of trade for pastoralists and wage laborers has declined substantially since last year
Resident groups • Most households are residents • Very few internally displaced persons and nomads sampled
Sex of household head • Almost one third of households are headed by women
Source of income • Half of households have only one source of cash income
Land ownership • Access to land is very high
Cereal production • Average cereal production dropped by almost 50 percent • Cereal is sorghum, millet and maize • Y axis measurement is kg/household member
1TLU 10sheep 10goats = = = 1.25donkeys 1.25cattle 1horse 1camel = = = Tropical Livestock Unit (TLU)
Livestock ownership • Most households own no or little livestock • Mean tropical livestock unit: 1.51 • Thresholds:1) No or little: 0 - 0.5 TLU • 2) Medium: 0.5 - 2.5 TLU • 3) Large: 2.5 TLU -
Access to credit • A majority of households have no access to credit
Use of credit • Buying food is by far the most common use of credit
Remittances • About one out of five households receive remittances
Food shortage and coping • Eating less quantities and getting food on credit are the most common coping strategies
Short-term priorities • Food aid is the highest priority for most households, in the short run • Cash assistance is the second highest
Long-term priorities • Agricultural inputs is the most common priority, in the long run • Health services and cash assistance comes next
Key concepts • Food security Food security = Food consumption + Food access • Food consumption Seven day food consumption • Food access Absolute food expenditure Relative food expenditure Cereal production
Food consumption • Majority of households have acceptable food consumption • Thresholds: • 1) 0 - 21 (sorghum daily, pulses twice a week, vegetables once) • 2) 21 - 35 • 3) 35 -
Absolute food expenditure • Half of households have acceptable absolute expenditure on food • Thresholds: • 1) 0 – 2 SDG (median of the two bottom quintiles) • 2) 2 – 4.6 SDG (median of the distribution) • 3) 4.6 - Mean absolute food expenditure per capita: 6.7 SDG
Relative food expenditure • Almost a third of households spend more than half of their income on food • Thresholds: • 1) 0% - 50% • 2) 50% - 65% • 3) 65% - Mean relative food expenditure: 55%
Cereal production • The vast majority of households produce less than half of their requirement • Thresholds: • 1) 0 – 73 kg/person • 2) 73 - 146 kg/person • 3) 146 kg/person - Mean cereal production per capita: 38 kg/person
Food security Severely food insecure: 34,022 persons Moderately food insecure:44,490 persons Food secure:17,665 persons
Sex of household head • Food insecurity strongly associated with sex of household head • Members of women headed households are vulnerable
Cereal production • Dramatic harvest decline 2006-2007 • Decline in harvest hitting severely and moderately food insecure disproportionately
Livestock ownership • Food insecure households tend to hold less livestock
Food source • Food insecure households rely more on own production and less on the market for food.
Food shortage and coping • Severely food insecure households experience more food shortage • About 60% of severely food insecure households eat less than normal (or less preferred food)
Where are the food insecure? Zoning: highlands and lowlands
Food security • More severely food insecure live in the highlands • More food secure live in the lowlands
Sex of household head • More female headed households live in the highlands
Main income source – past 6 months • Non agricultural labour is dominant in the lowlands • Sale of firewood, charcoal and grass is important in both areas • Livestock sale is important for the highlands • Remittances are more important in the highlands
Cultivation • More households did not cultivate in the lowlands
Cereal production • Both areas produced less in 2007 compared to 2006 • Highlands produced less than lowlands in both agricultural seasons
Livestock ownership • Households in the highlands in average tend to own more livestock than households on the lowlands
Food source • Household in the highlands rely more on own production and from other sources • Household in the lowlands tend to rely mainly on the market • Lowlands’ economies tend to be more cash-based
Assets • Households in the lowlands tend to have in average more assets
Access to credit • Household in the highlands have less opportunities to access credit
Short-term priorities • Food aid for both areas nut higher for highlands • Cash assistance requested especially in the lowlands
Long-term priorities • Agricultural inputs felt as important • Drinking water in the highlands
Food aid • Households in the highlands tend to be recipient of food aid