Download
1 / 36
360 likes | 480 Vues
Rapid Follow up Food Security Assessment. Flood and Water Logging Affected Areas of Satkhira and Jessore. Outline of Presentation. Methodology and field work process Lessons learnt and Recommendation Key Findings Food Availability: Local Agriculture Dynamics

E N D
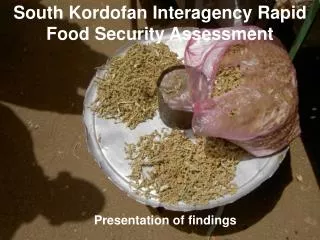
Rapid Follow up Food Security Assessment Flood and Water Logging Affected Areas of Satkhira and Jessore
Outline of Presentation • Methodology and field work process • Lessons learnt and Recommendation • Key Findings • Food Availability: Local Agriculture Dynamics • Food Accessibility: Income and other issues • Food Utilization: WaSH, Under Nutrition and other issues • Coping Strategies and Priority Needs • Overall Need in the Area
Methodology Applied tools and lessons learned
Lessons learned and recommendations • Checklists required more contextualization • Field practice was required for the enumerators • Group formation and relative representation of the communities • More preparatory work for UzDMC and UDMC consultation meeting is required • Preparing questionnaire bank for each of the dimensions of Food Security • Organizing a core expert team from TWG members to do this • Field practice of the enumerator
Food Availability Local agricultural dynamics
Boro- ‘average yield’ with low price • Per acre profit is only 4577 tk. • Average yield/acre is almost same as last years • Price has decrease almost 27% comparing last year. • How much a marginal farmer (less then 1.5 acre) can reinvest?
Other crops • No Maize and Mungbean. • Only in 29 % of the communities usually cultivates other pulses and oil seeds. Prospect seems to be moderate to normal. • Only in 21% of the communities reported to cultivate betel leaf the production prospect is either limited or moderate quantity. • Only 10% of the communities reported to have plan for summer vegetables with a low potential.
Cramped Investment Sources If MFI is the major source, can the interest rate be suitable?
Shrimp/fish gher • Only 7% area is likely to have a >50% production. • Livestock recovery status is very poor. • Employment impact?
Food Accessibility Income, livelihoods and other issues
Key constraints in reviving livelihoods Lack of financial resources ` `
Child and female labour increased- persisting low wage • 71% of the communities sent children to earn money • Average wage is only 50-75 Tk./day • Involvement in extremely hazardous work • In all the communities women started to work to support the HH • Average wage is only 40-90 Tk./day
Food Utilization Consumption, under-nutrition, WaSH and other issues
Health risk? • OD along with child feces disposal is a critical health threat to the overall well being of the communities.
ToT and Market Rapid Market Survey
Population in Needs Geographical position
Maps been produced considering 3 criteria; • Priority ranking by the UzDMC and UDMC members • Filtering with last boro production • Further filtering with aman potential.