
GRAPHS!!
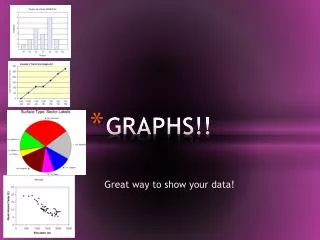
GRAPHS!!. Great way to show your data!. In your journal, draw a 4 square grid. 4 Types of graphs . In the first box, write bar graph and then draw an example In the second box, write line graph and then draw an example In the third box, write pie chart and then draw an example

GRAPHS!!
E N D
Presentation Transcript
GRAPHS!! Great way to show your data!
In your journal, draw a 4 square grid 4 Types of graphs
In the first box, write bar graph and then draw an example • In the second box, write line graph and then draw an example • In the third box, write pie chart and then draw an example • In the fourth box, write scatter plot and then draw an example Bar graph Line graph 4Types of Graphs Scatter plot Pie chart
In your journal, draw the following table (2 columns, 5 rows) Components of a Graph
BAR GRAPH: Compares two or more values Purposes of different graphs
LINE GRAPH: Shows change over time Purposes of different graphs
PIE CHART: Shows percent of total (must equal 100% when you add each part together) Purposes of different graphs
SCATTER PLOT: Shows a correlation between two items (there is no independent variable, usually) Purposes of different graphs