Download
1 / 21
210 likes | 347 Vues
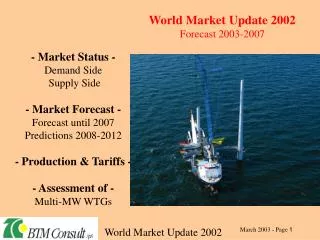
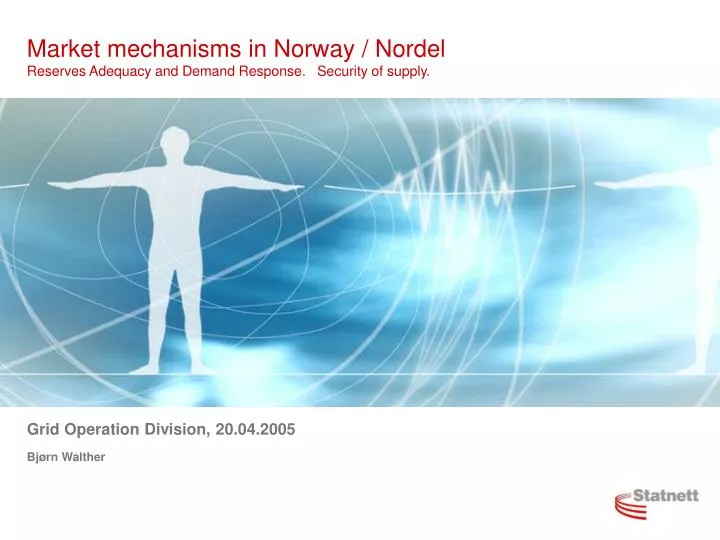
Market mechanisms in Norway / Nordel Reserves Adequacy and Demand Response. Security of supply. Grid Operation Division, 20.04.2005. Bjørn Walther. Driving Forces behind Liberalization. Political willingness and consensus on liberalization

E N D
Market mechanisms in Norway / Nordel Reserves Adequacy and Demand Response. Security of supply. Grid Operation Division, 20.04.2005 Bjørn Walther
Driving Forces behind Liberalization • Political willingness and consensus on liberalization • Legal framework put in place and adjusted to ensure competition • Regulator established in all countries • Independent Transmission System Operator (TSO) created in all countries to facilitate market development
Requirements: Co-operation between all five Nordic TSOs on issues required to form one common market Co-operation regulated in: “The Inter-Nordic Transmission System Operation Agreement” Elkraft System Eltra Statnett Fingrid Svenska Kraftnät Inter-Nordic Transmission System Operation Agreement Forming a Nordic Electricity Market
The mix of electricity generationThe Nordic electricity market in 2003 (%)
Time RKOM A catalyst to secure sufficient regulating power to be available in the Balance Market Various markets and their timescale
Option market RKOM Duration one week Catalyst for RKM Consumption Option Market as a catalyst for the Balancing Market places including options when needed G Elspot C 12 hours in advance Generation RKM The hour of operation The market place
Volume in MWh 6 000 Purchase System price 124 5 000 Sale 4 000 3 000 2 000 1 000 0 0 20 40 60 80 100 120 140 160 180 200 Price in NOK The Nordic intra-day Market (Elspot)
Common Nordic Balance Management Price Highest up regulation Price = Sales price Upward regulation Spot price = base price Downward regulation MW Lowest down regulation Price = Purchase price
The highest value for upregulating i BM 10% Norwegian balancingNeed 2001. Duration curve(frequency control only)
Common Balancing Market • Established 1th September 2002 • Results so far: • Efficient balance control • Lower total control costs for the TSOs • Improved overview and reliability due to simplified routines • Equalisation of the Balancing Power Price • Increased interest in offering on the Balancing Market • Harmonisation of balance settlement • TSOs work as one company in this respect
Activation of demand response (DR) • Day-ahead Market according to price • More eksplisit response • More flexible products • Balancing Market according to situation • According to deviation in forecasted consumption • According to disturbances • Present in both markets • Excluded in RK-Market if activated in Elspot
Acquisition of Reserves Options Overwiew from the beginning, nov 2000
Nordic perspective • The Nordic potential for DR is large • Increasing need of operating reserves and DR, as a consequence of more windpower installed • Nordic coordination is important and will reduce the total cost of keeping the necessary amount of capacity reserves
NOK/MWh 400 350 300 Norways last political decided price 1991 1996 250 1994 200 2001 1997 1993 1998 1995 150 1999 2000 100 1992 50 0 Jan Feb Mar Apr May Jun Jul Aug Sep Oct Nov Desc Source: Nord Pool Market pricesThe Nordic Electricity Market 1992 -2001 • 1 Euro = 8.30 NOK (01.09.2003)
How to ensure Security of supply • Supply / demand balance in normal years • Power exchange capacity against continental Europe • Price elasticity in demand • A set of ”tools” for extreme years
Conclusion –The Nordic Experience • Reduced prices to the customers • Better service to the customers • Cost efficient operation • Flexible power flow • Reduced overcapasity • Focus on the economy
Web-sites LANDSNETwww.landsnet.is www.energinet.dk