Understanding the Simplex Algorithm: Steps to Find Optimal Solutions
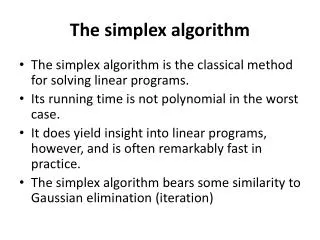
This guide details the Simplex Algorithm, an iterative method for solving linear programming problems. It begins by identifying the pivotal column with the most negative term. Subsequently, it involves calculating θ-values to determine the pivot element and adjusting the tableau. Through repeated steps, the algorithm aims to achieve a tableau with no negative elements in the objective row, indicating that the optimal solution has been found. The final solution can be interpreted through the basic variable column, showcasing the values of the decision variables.

Understanding the Simplex Algorithm: Steps to Find Optimal Solutions
E N D
Presentation Transcript
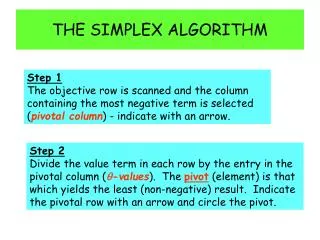
THE SIMPLEX ALGORITHM Step 1 The objective row is scanned and the column containing the most negative term is selected (pivotal column) - indicate with an arrow. Step 2 Divide the value term in each row by the entry in the pivotal column (-values). The pivot(element) is that which yields the least (non-negative) result. Indicate the pivotal row with an arrow and circle the pivot.
Step 3 Divide the whole pivotal row by the pivot (this leaves the number 1 in place of the pivot) and change the basic variables. Step 4 The aim now is to get zeros everywhere else in the selected column. This is done by adding to each row, multiples of the new pivotal row. The new rows form the next tableau. (You should now have zeros in the pivotal column except for a one where the pivot was) Step 5 Steps 1 to 4 are repeated until the objective row contains no negative elements. At this point, the objective has been attained.
Step 6 To “decode” the information, read down the “basic variable” column, the number in the value column gives the value of that variable. The value of all other variables not present in the final tableau is zero. This is the optimal solution. This will all appear meaningless until we illustrate it with an example
Maximise the function Introduce slack variables as follows: 2x + y + 1r + 0s = 32 x + y + 0r + 1s = 18 f – 80x – 70y + 0r + 0s = 0 This can be set out in a table as follows:
Step 4 The aim now is to get zeros everywhere else in the selected column. This is done by adding to each row, multiples of the new pivotal row. The new rows form the next tableau. (You should now have zeros in the pivotal column except for a one where the pivot was) Step 2 Divide the value term in each row by the entry in the pivotal column (-values). The pivot(element) is that which yields the least (non-negative) result. Indicate the pivotal row with an arrow and circle the pivot. Step 3 Divide the whole pivotal row by the pivot (this leaves the number 1 in place of the pivot) and change the basic variables. Step 1 The objective row is scanned and the column containing the most negative term is selected (pivotal column) - indicate with an arrow. Objective function f - 80x - 70y + 0r + 0s = 0 2x + y + 1r + 0s = 32 x + y + 0r + 1s = 18 θ values x 2 1 0.5 1 0.5 1 0 32 16 32/2 = 16 0 1 0.5 1 - 0.5 0 1 1 18 2 18/1 = 18 R2 – R1 Don’t do this for the objective row -80 0 -30 -70 40 0 0 0 1280 0 R3 + 80R1
Step 5 Steps 1 to 4 are repeated until the objective row contains no negative elements. At this point, the objective has been attained. Step 4 The aim now is to get zeros everywhere else in the selected column. This is done by adding to each row, multiples of the new pivotal row. The new rows form the next tableau. (You should now have zeros in the pivotal column except for a one where the pivot was) Step 2 Divide the value term in each row by the entry in the pivotal column (-values). The pivot(element) is that which yields the least (non-negative) result. Indicate the pivotal row with an arrow and circle the pivot. Step 3 Divide the whole pivotal row by the pivot (this leaves the number 1 in place of the pivot) and change the basic variables. Step 1 The objective row is scanned and the column containing the most negative term is selected (pivotal column) - indicate with an arrow. We now have the following tableau: θ values R1 - ½R2 1 1 0.5 0 0.5 1 -1 0 16 14 16/0.5 = 32 y 0 0 0.5 1 -0.5 - 1 1 2 2 4 2/0.5 = 4 R3 + 30R2 0 0 -30 0 40 10 60 0 1280 1400
Step 6 To “decode” the information, read down the “basic variable” column, the number in the value column gives the value of that variable. The value of all other variables not present in the final tableau is zero. This is the optimal solution. Step 5 Steps 1 to 4 are repeated until the objective row contains no negative elements. At this point, the objective has been attained. We now have the following tableau: Also r = s = 0 x = 14 y = 4 No negatives f = 1400