
Uploaded by
elijah
1 SLIDES
124 VUES
10LIKES
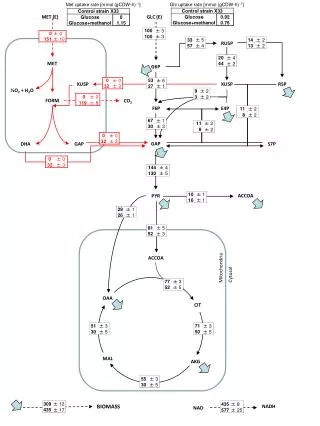
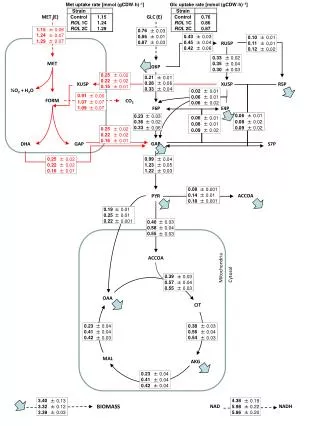
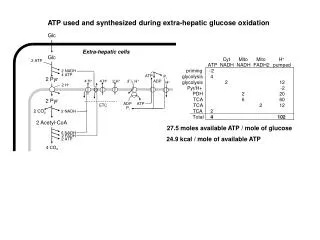
Metabolic Rates Comparison: Glucose and Methionine Uptake in Cells
DESCRIPTION
Explore the metabolic characteristics of glucose and methionine uptake in cells represented as mmol per gCDW per hour. Understand the complex metabolic pathways involved through key intermediates such as RU5P, G6P, and XU5P. Analyze the impact of oxygen consumption and carbon dioxide generation. Compare key metabolites like F6P, E4P, and GAP, highlighting the role of mitochondria and cytosol in the process.
Download
1 / 1
Télécharger la présentation 
Metabolic Rates Comparison: Glucose and Methionine Uptake in Cells
An Image/Link below is provided (as is) to download presentation
Download Policy: Content on the Website is provided to you AS IS for your information and personal use and may not be sold / licensed / shared on other websites without getting consent from its author.
Content is provided to you AS IS for your information and personal use only.
Download presentation by click this link.
While downloading, if for some reason you are not able to download a presentation, the publisher may have deleted the file from their server.
During download, if you can't get a presentation, the file might be deleted by the publisher.
E N D
Presentation Transcript
Met uptake rate [mmol (gCDW·h)1] Glc uptake rate [mmol (gCDW·h)1] MET (E) GLC (E) RU5P MET G6P XU5P XU5P R5P ½O2 + H2O FORM CO2 F6P E4P GAP DHA GAP S7P ACCOA PYR ACCOA Mitochondria Cytosol OAA CIT MAL AKG BIOMASS NADH NAD


More Related
Audio
Live Player