Download
1 / 90
900 likes | 1.11k Vues
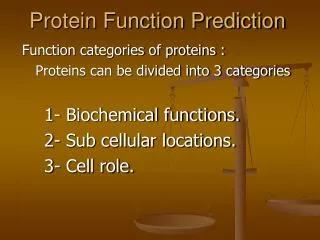
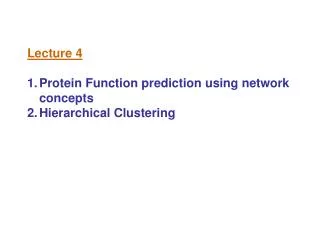
Lecture 4 Protein Function prediction using network concepts Hierarchical Clustering. Topology of Protein-protein interaction is informative but further analysis can reveal other information.

E N D
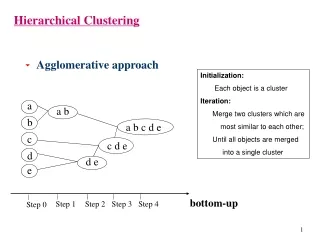
Lecture 4 • Protein Function prediction using network concepts • Hierarchical Clustering
Topology of Protein-protein interaction is informative but further analysis can reveal other information. A popular assumption, which is true in many cases is that similar function proteins interact with each other. Based on these assumption, we have developed methods to predict protein functions and protein complexes from the PPI networks mainly based on cluster analysis.
Cluster Analysis Cluster Analysis, also called data segmentation, implies grouping or segmenting a collection of objects into subsets or "clusters", such that those within each cluster are more closely related to one another than objects assigned to different clusters. In the context of a graph densely connected nodes are considered as clusters Visually we can detect two clusters in this graph
K-cores of Protein-Protein Interaction Networks Definition Let, a graph G=(V, E) consists of a finite set of nodes V and a finite set of edges E. A subgraph S=(V, E) where V V and E E is a k-core or a core of order k of G if and only if v V: deg(v) k within S and S is the maximal subgraph of this property.
Concept of a k-core graph Graph G 1-core graph: The degree of all nodes are one or more
Concept of a k-core graph 1-core graph: The degree of all nodes are one or more
Concept of a k-core graph 2-core graph: The degree of all nodes are two or more
Concept of a k-core graph 1-core graph: The degree of all nodes are one or more
Graph G 3-core graph: The degree of all nodes are three or more The 3-core is the highest k-core subgraph of the graph G
Application of a k-core graph Analyzing protein-protein interaction data obtained from different sources, G. D. Bader and C.W.V. Hogue, Nature biotechnology, Vol 20, 2002
Introduction : Function prediction Schwikowski, B., Uetz, P. and Fields, S. A network of protein-protein interactions in yeast. Nature Biotech. 18, 1257-1261 (2000) Deals with a network of 2039 proteins and 2709 interactions. 65% of interactions occurred between protein pairs with at least one common function Hishigaki, H., Nakai, K., Ono, T., Tanigami, A., and Tagaki, T. Assessment of prediction accuracy of protein function from protein-protein interaction data. Yeast 18, 523-531 (2001) Reported similar results..
Introduction : Function prediction Hypothesis Unknown function proteins that form densely connected subgraph with proteins of a particular function may belong to that functional group. We utilize this concept by determining k-cores of strategically constructed sub-networks.
Prediction of Protein Functions Based on K-cores of Protein-Protein Interaction Networks “Prediction of Protein Functions Based on K-cores of Protein-Protein Interaction Networks and Amino Acid Sequences”, Md. Altaf-Ul-Amin, Kensaku Nishikata, Toshihiro Koma, Teppei Miyasato, Yoko Shinbo, Md. Arifuzzaman, Chieko Wada, Maki Maeda, Taku Oshima, Hirotada Mori, Shigehiko Kanaya The 14th International Conference on Genome Informatics December 14-17, 2003, Yokohama Japan.
E.Coli PPI network Total 3007 proteins and 11531 interactions Around 2000 are unknown function proteins Highest K-core of this total graph is not so helpful
We separate 1072 interactions (out of 11531) involving protein synthesis and function unknown proteins. P. S. U. F. P. S. P. S.
Function unknown Proteins of this 6-kore graph are likely to be involved in protein synthesis Unknown
Extending the k-core based function prediction method and its application to PPI data of Arabidopsis thaliana Protein Function Prediction based on k-cores of Interaction Networks, Norihiko Kamakura, Hiroki Takahashi, Kensuke Nakamura, Shigehiko Kanaya and Md. Altaf-Ul-Amin, Proceedings of 2010 International Conference on Bioinformatics and Biomedical Technology (ICBBT 2010)
Materialsand Methods : Dataset All PPI data of Arabidopsis thaliana • 3118 interactions involving 1302 proteins. • Collected from databases and scientific literature by our laboratory. Green= Unknown proteins (289 proteins) Pink= Known proteins (1013 proteins)
Materials and Methods : DatasetFunctional groups in the network The PPI dataset contains proteins of 19 different functions according to the first level categories of the KNApSAcK database.
Materials and Methods : DatasetThe trends of interactions in the context of functional similarity Diagonal elements show number of interactions between similar function proteins.
Results : Subnetworks Subnetwork Name Number of interactions we do not consider in this work the sub-networks that contain less than 100 interactions. And finally I consider subnetworks corresponding to 9 functional classes.
Results : Subnetwork corresponding to cellular communication As an example here we show the subnetworks and k-cores corresponding to cellular communication. Subnetwork extraction We extracted the following 3 types of interactions. Cellular communication-Cellular communication Cellular communication-Unknown, Unknown-Unknown Total 603 interactions
Results : Subnetwork corresponding to cellular communication 1-core The red nodes : known proteins. The green nodes : unknown proteins.
Results : k-cores corresponding to cellular communication 2-core 3-core The red nodes : known proteins. The green nodes : unknown proteins. The red color nodes represent known proteins, the green color nodes represent function unknown proteins.
Results : k-cores corresponding to cellular communication 4-core 5-core The red nodes : known proteins The green nodes : unknown proteins. 6-core 7-core This figure implies that determination of k-cores in strategically constructed sub-networks can reveal which unknown proteins are densely connected to proteins of a particular functional class.
Results: Function Predictions The number of unknown genes included in different k-cores corresponding to different functional groups
Results: Function Predictions Prediction based on 2-cores, 3-cores and 4-cores 4-core 2-core Most proteins have been assigned unique functions 3-core Most proteins have been assigned unique functions and some have been assigned multiple functions
Assessment of Predictions As most of the function predicted proteins are still unknown their annotations do not contain clear information on their functions. When k is much larger than one, the effect of false positives is greatly reduced. However to assess statistically, we constructed 1000 random graphs consisting of the same 1,302 proteins but I inserted 3,118 edges randomly and constructed subnetworks.
Assessment of Predictions The box plots show the distribution of k-cores with respect to their size in 1000 graphs corresponding to each sub-network and the filled triangles show the size of k-cores in real PPI sub-networks.
Assessment of Predictions • it can be theoretically concluded that the existence of higher order k-core graphs in PPI sub-networks compared to in the random graphs of the same size are likely to be because of interaction between similar function proteins. • Therefore we assume that the function prediction based on k-cores for the value of k greater than highest possible value of k for corresponding random graphs are statistically significant predictions. • Based on this we predicted the functions of 67 proteins(list is available online at http://kanaya.naist.jp/Kcore/supplementary/Function_prediction.xls. 34
“Prediction of Protein Functions Based on Protein-Protein Interaction Networks: A Min-Cut Approach”, Md. Altaf-Ul-Amin, Toshihiro Koma, Ken Kurokawa, Shigehiko Kanaya, Proceedings of the Workshop on Biomedical Data Engineering (BMDE), Tokyo, Japan, pp. 37-43, April 3-4, 2005.
Outline • Introduction • The concept of Min-Cut • Problem Formulation • A Heuristic Method • Evaluation of the Proposed Method • Conclusions
Outline • Introduction • The concept of Min-Cut • Problem Formulation • A Heuristic Method • Evaluation of the Proposed Method • Conclusions
Introduction After the complete sequencing of several genomes, the challenging problem now is to determine the functions of proteins • Determining protein functions experimentally • Using various computational methods a) sequence b) structure c) gene neighborhood d) gene fusions e) cellular localization f) protein-protein interactions
Introduction Present work predicts protein functions based on protein-protein interaction network. • For the purpose of prediction, we consider the interactions of • function-unknown proteins with function-known proteins and • function-unknown proteins with function-unknown proteins In the context of the whole network.
Introduction Majority of protein-protein interactions are between similar function protein pairs. Therefore, We assign function-unknown proteins to different functional groups in such a way so that the number of inter-group interactions becomes the minimum. Hence we call the proposed approach a Min-Cut approach.
Outline • Introduction • The concept of Min-Cut • Problem Formulation • A Heuristic Method • Evaluation of the Proposed Method • Conclusions
The concept of Min-Cut U4 K8 U3 K1 K4 U2 K6 K2 K3 U1 K5 G1 G2 A typical and small network of known and unknown proteins
The concept of Min-Cut U4 K U3 K K U2 K K K U1 K G1 G2 Unknown proteins assigned to known groups based on majority interactions
The concept of Min-Cut U4 K U3 K K U2 K K K U1 K G1 G2 Number of CUT = 4
The concept of Min-Cut U4 K U3 K K U2 K K K U1 K G1 G2 An alternative assignment of unknown proteins
The concept of Min-Cut U4 K U3 K K U2 K K K U1 K G1 Number of CUT = 2 G2 For every assignment of unknown proteins, there is a value of CUT. Min-cut approach looks for an assignment for which the number of CUT is minimum.
Outline • Introduction • The concept of Min-Cut • Problem Formulation • A Heuristic Method • Evaluation of the Proposed Method • Conclusions
Problem Formulation Here we explain some points with a typical example.
Problem Formulation V= set of all nodes E =set of all edges G={K1, K2, K3, K4, K5, K6, K7, K8, K9, K10} U={U1, U2, U3, U4, U5, U6, U7, U8}
Problem Formulation We generate U´ U such that each protein of U´ is connected in N with at least one protein of group G by a path of length 1 or length 2. U´= {U1, U2, U3, U4, U5, U6, U7}