Download
1 / 25
250 likes | 560 Vues
Methods for Improving Protein Disorder Prediction. Slobodan Vucetic1, Predrag Radivojac3, Zoran Obradovic3, Celeste J. Brown2, Keith Dunker2 1 School of Electrical Engineering and Computer Science, 2 Department of Biochemistry and Biophysics Washington State University, Pullman, WA 99164

E N D
Methods for Improving Protein Disorder Prediction Slobodan Vucetic1, Predrag Radivojac3, Zoran Obradovic3, Celeste J. Brown2, Keith Dunker2 1 School of Electrical Engineering and Computer Science, 2 Department of Biochemistry and Biophysics Washington State University, Pullman, WA 99164 3 Center for Information Science and Technology Temple University, Philadelphia, PA 19122
ABSTRACT Attribute construction, choice of classifier and post-processing were explored for improving prediction of protein disorder. While ensembles of neural networks achieved the higher accuracy, the difference as compared to logistic regression classifiers was smaller then 1%. Bagging of neural networks, where moving averages over windows of length 61 were used for attribute construction, combined with postprocessing by averaging predictions over windows of length 81 resulted in 82.6% accuracy for a larger set of ordered and disordered proteins than used previously. This result was a significant improvement over previous methodology, which gave an accuracy of 70.2%. More-over, unlike the previous methodology, the modified attribute construction allowed prediction at protein ends.
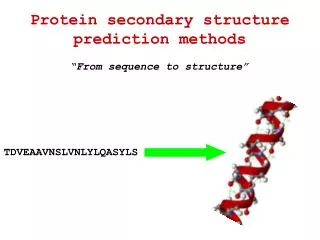
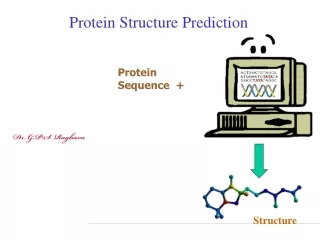
Amino Acid Sequence 3-D Structure Protein Function Motivation Standard ``Lock and Key’’ Paradigmfor Protein Structure/Function Relationships (Fischer, Ber. Dt. Chem. Ges.,1894)
(Kissinger et al, Nature, 1995) Protein Disorder - Part of a Protein without a Unique 3D StructureExample: Calcineurin Protein ? ?
Overall ObjectiveBetter Understand Protein Disorders Hypothesis: • Since amino acid sequence determines structure, sequence should determine lack of structure (disorder) as well. Test • Construct a protein disorder predictor • Check its accuracy • Apply it on large protein sequence databases
Objective of this Study • Previous results showed that disorder can be predicted from sequence with ~70% accuracy (based on 32 disordered proteins) • Our goals are to increase accuracy by • Increasing database of disordered proteins • Improving knowledge representation and attribute selection • Examining predictor types and post-processing • Perform extensive cross-validation using different accuracy measures
Data Sets • Searching disordered proteins (DIFFICULT) • Keyword search of PubMed (http://www.ncbi.nlm.nih.gov) for disorders identified by NMR, Circular dichroism, protease digestion • Search over Protein Data Bank (PDB) for disorders identified by X-ray crystallography • Searching ordered proteins (EASY) • Most proteins in Protein Data Bank (PDB) are ordered
Data Sets • Set of protein disorders (D_145) • Search revealed 145 nonredundant proteins (<25% identity) with long disordered regions (>40 amino acids) with 16,705 disordered residues • Set of ordered proteins (O_130) • 130 nonredundant completely ordered proteins with 32,506 residues were chosen to represent examples of protein order
Data representationBackground • Conformation is mostly influenced by locally surrounding amino acids • Higher order statistics not very useful in proteins [Nevill-Manning, Witten, DCC 1999] • Domain knowledge is a source of potentially discriminative features
Attribute Selection(including protein ends) W C Y L A A MA H Q F A G A G K L KC T S A L S C T Calculate over window: 20 Compositions K2 entropy 14Å Contact Number Hydropathy Flexibility Coordination Number Bulkiness CFYW Volume Net Charge WINDOW (size = Win) class: (1 / 0) (disordered/ordered) SEQUENCE
Attribute Selection (including protein ends) • Attribute construction resembles low-pass filtering. Consequence • effective data size of D_145 is ~ 2*16,705/Win • effective data size of O_130 is ~ 2*32,506/Win • K2 entropy - low complexity proteins are likely disordered • Flexibility, Hydropathy, etc. - correlated with disorder • 20 AA compositions - occurrence or lack of some AA from the window is correlated with disorder incidence
Disorder Predictor Models We examine: • Logistic Regression (LR) Classification model, stable, linear • Neural Networks Slow training, unstable, powerful, need much data • Ensemble of Neural Networks (Bagging, Boosting) Very slow, stable, powerful
Data Disorder Predictor Prediction Wout Filter Postprocessing • We examine LONG disordered regions: • neighboring residues likely belong to the same ordered/disordered region • Predictions can be improved: • Perform moving averaging of prediction over a window of length Wout
Accuracy Measures • Length of disordered regions in different proteins varies from 40 to 1,800 AA • We measure two types of accuracy • Per-residue (averaged over residues) • Per-protein (averaged over proteins) • ROC curve - measures True Positive (TP) against False Negative (FN) predictions
Experimental Methodology • Balanced data sets of order/disorder examples • Cross-validation: • 145 disordered proteins divided into 15 subsets (15-fold cross validation for TP accuracy) • 130 ordered proteins divided into 13 subsets (13-fold CV for TN accuracy) • To prevent collinearity and overfitting 20 attributes are selected (18 AA compositions, Flexibility and K2 entropy)
Experimental Methodology • 2,000 examples randomly selected for training • Feedforward Neural Networks with one hidden layer and 5 hidden nodes. • 100 epochs of resilient backpropagation • Bagging and Boosting ensembles with 30 neural networks • Examined Win, Wout = {1, 9, 21, 41, 61, 81, 121} • For each pair (Win, Wout) CV repeated 10 times for neural networks and once for Logistic Regression, Bagging and Boosting
Results – Model Comparison Per-protein accuracy, (Win, Wout) = (41,1) • Neural networks slightly more accurate then linear predictors • Ensemble of NNs slightly better then individual NN • Boosting and Bagging result in similar accuracy
DISORDER ORDER • TN rate is significantly higher then TP rate (~ 10%) • Indication that attribute space coverage of disorder is larger then coverage of order • Disorder is more diverse then order
Results – Influence of Filter SizePer-protein accuracy with bagging Win=61 • Different pairs of (Win, Wout) can result in similar accuracy • Wout=81 seems to be the optimal choice Win=21 Win=9
Results – Optimal (Win, Wout)Per-protein and per-residue accuracy of bagging Per-residue accuracy gives higher values For a wide range of Win, optimal Wout=81 The best result achieved with (Win, Wout) = (41,1)
Results – ROC CurveCompare (Win, Wout) = (21,1) and (61,81) • (Win, Wout) = (61,81) is superior: ~10% improvement in per-protein accuracy • (Win, Wout) = (21,1) corresponds to our previous predictor (61,81) (21,1)
Results – Accuracy at Protein EndsComparison on O_130 proteins • Comparison of accuracies at the first 20 (Region I) and last 20 (Region II) positions of O_130 proteins Solid: (Win=61, Wout=81) Dashed: (Win=21, Wout=1)
Results – Accuracy at Protein EndsComparison on D_145 proteins Solid: (Win=61, Wout=81) • Averaged accuracies of the first 20 positions of 91 disorder regions that start at the beginningof protein sequence (Region I) and 54 disordered regions that do not start at the beginning of protein sequence (Region II) Averaged accuracies of the last 20 positions of 76 disordered regions that do not end at the end of protein sequence (Region III) and 69 disorder regions that end at the end of protein sequence (Region IV). Dashed: (Win=21, Wout=1)
Conclusions • Modifications in data representation, attribute selection, and prediction post-processing were proposed • Predictors of different complexity were proposed • Achieved 10% accuracy improvement over our previous predictors • Difference in accuracy between linear models and ensembles of neural networks is fairly small
Acknowledgements Support from NSF-CSE-IIS-9711532 and NSF-IIS-0196237 to Z.O. and A.K.D. and from N.I.H. 1R01 LM06916 to A.K.D. and Z.O is gratefully acknowledged.