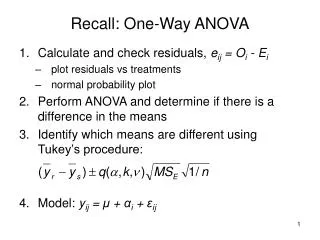
One-Way ANOVA
One-Way ANOVA. One-Way Analysis of Variance. One-Way ANOVA. The one-way analysis of variance is used to test the claim that three or more population means are equal This is an extension of the two independent samples t-test. One-Way ANOVA.


One-Way ANOVA
E N D
Presentation Transcript
One-Way ANOVA One-Way Analysis of Variance
One-Way ANOVA • The one-way analysis of variance is used to test the claim that three or more population means are equal • This is an extension of the two independent samples t-test
One-Way ANOVA • The response variable is the variable you’re comparing • The factor variable is the categorical variable being used to define the groups • We will assume k samples (groups) • The one-way is because each value is classified in exactly one way • Examples include comparisons by gender, race, political party, color, etc.
One-Way ANOVA • Conditions or Assumptions • The data are randomly sampled • The variances of each sample are assumed equal • The residuals are normally distributed
One-Way ANOVA • The null hypothesis is that the means are all equal • The alternative hypothesis is that at least one of the means is different • Think about the Sesame Street® game where three of these things are kind of the same, but one of these things is not like the other. They don’t all have to be different, just one of them.
One-Way ANOVA • The statistics classroom is divided into three rows: front, middle, and back • The instructor noticed that the further the students were from him, the more likely they were to miss class or use an instant messenger during class • He wanted to see if the students further away did worse on the exams
One-Way ANOVA The ANOVA doesn’t test that one mean is less than another, only whether they’re all equal or at least one is different.
One-Way ANOVA • A random sample of the students in each row was taken • The score for those students on the second exam was recorded • Front: 82, 83, 97, 93, 55, 67, 53 • Middle: 83, 78, 68, 61, 77, 54, 69, 51, 63 • Back: 38, 59, 55, 66, 45, 52, 52, 61
One-Way ANOVA The summary statistics for the grades of each row are shown in the table below
One-Way ANOVA • Variation • Variation is the sum of the squares of the deviations between a value and the mean of the value • Sum of Squares is abbreviated by SS and often followed by a variable in parentheses such as SS(B) or SS(W) so we know which sum of squares we’re talking about
One-Way ANOVA • Are all of the values identical? • No, so there is some variation in the data • This is called the total variation • Denoted SS(Total) for the total Sum of Squares (variation) • Sum of Squares is another name for variation
One-Way ANOVA • Are all of the sample means identical? • No, so there is some variation between the groups • This is called the between group variation • Sometimes called the variation due to the factor • Denoted SS(B) for Sum of Squares (variation) between the groups
One-Way ANOVA • Are each of the values within each group identical? • No, there is some variation within the groups • This is called the within group variation • Sometimes called the error variation • Denoted SS(W) for Sum of Squares (variation) within the groups
One-Way ANOVA • There are two sources of variation • the variation between the groups, SS(B), or the variation due to the factor • the variation within the groups, SS(W), or the variation that can’t be explained by the factor so it’s called the error variation
One-Way ANOVA • Here is the basic one-way ANOVA table
One-Way ANOVA • Grand Mean • The grand mean is the average of all the values when the factor is ignored • It is a weighted average of the individual sample means
One-Way ANOVA • Grand Mean for our example is 65.08
One-Way ANOVA • Between Group Variation, SS(B) • The between group variation is the variation between each sample mean and the grand mean • Each individual variation is weighted by the sample size
One-Way ANOVA The Between Group Variation for our example is SS(B)=1902 I know that doesn’t round to be 1902, but if you don’t round the intermediate steps, then it does. My goal here is to show an ANOVA table from MINITAB and it returns 1902.
One-Way ANOVA • Within Group Variation, SS(W) • The Within Group Variation is the weighted total of the individual variations • The weighting is done with the degrees of freedom • The df for each sample is one less than the sample size for that sample.
One-Way ANOVA Within Group Variation
One-Way ANOVA • The within group variation for our example is 3386
One-Way ANOVA • After filling in the sum of squares, we have …
One-Way ANOVA • Degrees of Freedom, df • A degree of freedom occurs for each value that can vary before the rest of the values are predetermined • For example, if you had six numbers that had an average of 40, you would know that the total had to be 240. Five of the six numbers could be anything, but once the first five are known, the last one is fixed so the sum is 240. The df would be 6-1=5 • The df is often one less than the number of values
One-Way ANOVA • The between group df is one less than the number of groups • We have three groups, so df(B) = 2 • The within group df is the sum of the individual df’s of each group • The sample sizes are 7, 9, and 8 • df(W) = 6 + 8 + 7 = 21 • The total df is one less than the sample size • df(Total) = 24 – 1 = 23
One-Way ANOVA • Filling in the degrees of freedom gives this …
One-Way ANOVA • Variances • The variances are also called the Mean of the Squares and abbreviated by MS, often with an accompanying variable MS(B) or MS(W) • They are an average squared deviation from the mean and are found by dividing the variation by the degrees of freedom • MS = SS / df
One-Way ANOVA • MS(B) = 1902 / 2 = 951.0 • MS(W) = 3386 / 21 = 161.2 • MS(T) = 5288 / 23 = 229.9 • Notice that the MS(Total) is NOT the sum of MS(Between) and MS(Within). • This works for the sum of squares SS(Total), but not the mean square MS(Total) • The MS(Total) isn’t usually shown
One-Way ANOVA • Completing the MS gives …
One-Way ANOVA • Special Variances • The MS(Within) is also known as the pooled estimate of the variance since it is a weighted average of the individual variances • Sometimes abbreviated • The MS(Total) is the variance of the response variable. • Not technically part of ANOVA table, but useful none the less
One-Way ANOVA • F test statistic • An F test statistic is the ratio of two sample variances • The MS(B) and MS(W) are two sample variances and that’s what we divide to find F. • F = MS(B) / MS(W) • For our data, F = 951.0 / 161.2 = 5.9
One-Way ANOVA • Adding F to the table …
One-Way ANOVA • The F test is a right tail test • The F test statistic has an F distribution with df(B) numerator df and df(W) denominator df • The p-value is the area to the right of the test statistic • P(F2,21 > 5.9) = 0.009
One-Way ANOVA • Completing the table with the p-value
One-Way ANOVA • The p-value is 0.009, which is less than the significance level of 0.05, so we reject the null hypothesis. • The null hypothesis is that the means of the three rows in class were the same, but we reject that, so at least one row has a different mean.
One-Way ANOVA • There is enough evidence to support the claim that there is a difference in the mean scores of the front, middle, and back rows in class. • The ANOVA doesn’t tell which row is different, you would need to look at confidence intervals or run post hoc tests to determine that