Download
1 / 31
310 likes | 467 Vues
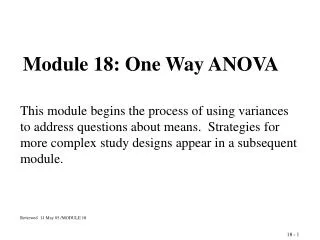
Module 18: One Way ANOVA. This module begins the process of using variances to address questions about means. Strategies for more complex study designs appear in a subsequent module. Reviewed 11 May 05 /MODULE 18. Independent Random Samples from Two Populations of Serum Uric Acid values.

E N D
Module 18: One Way ANOVA This module begins the process of using variances to address questions about means. Strategies for more complex study designs appear in a subsequent module. Reviewed 11 May 05 /MODULE 18 18 - 1
Independent Random Samples from Two Populations of Serum Uric Acid values 18 - 2
SS (Within) = SS (sample 1) + SS (sample 2) = 0.824 + 1.669 = 2.490 SS (Within) = 2.49 18 - 1
1. The hypothesis: H0: 1 = 2 vs H1: 1 2 2. The assumptions: Independent random samples , normal distributions, 3. The -level : = 0.05 4. The test statistic: ANOVA 5. The rejection region: Reject H0: 1 = 2 if 18 - 7
6. The result: 7. The conclusion: Reject H0: Since F = 10.86 > F0.95(1,18) = 4.41 18 - 8
Testing the Hypothesis that the Two Serum Uric Acid Populations have the Same Mean 1. The hypothesis: H0: 1 = 2vs H1: 1 2 2. The -level: = 0.05 3. The assumptions: Independent Random Samples Normal Distribution 4. The test statistic: 18 - 9
5. The reject region:Reject H0 if t is not between ± 2.1009 6. The result: 7. The conclusion:Reject H0 : 1 = 2since t is not between 2.1009 18 - 10
Example 2 18 - 11
SS(Among) = 11.236 + 25.921 + 22.201 - 57.685 = 1.673 SS(Within) = 0.824 + 1.669 + 1.169 = 3.662 SS(Total) = 1.673 + 3.662 = 5.335 18 - 13
The hypothesis: H0: µ1=µ2=µ3 ,vs. H1: µ1≠ µ2≠ µ3 • 2. The assumptions: Independent random samples normal distributions • 3. The -level : = 0.05 • 4. The test statistic: ANOVA Testing the Hypothesis that the Three populations have the same Average Serum Uric Acid Levels 18 - 14
Example 3 18 - 16
SS(Among) = 111,936 + 94,478 + 93,123 - 299,001 = 536.47 SS(Within) = 708 + 202 + 1,134 = 2,043.70 SS(Total) = 536 + 2,043 = 2,580.17 18 - 18
The hypothesis: • 2. The assumptions: Independent random samples normal distributions • 3. The -level : = 0.05 • 4. The test statistic: ANOVA Testing the Hypothesis That the Three Populations Have the Same Average Blood Pressure Levels 18 - 19
For Group 1, first child, Individual effect = = 100 - 105.8 = - 5.8 100 = 99.83 + 5.97 + ( -5.80) Xij = + i + ij Yij = + i + ij Individual Value = Overall Mean + Group Effect + Individual Effect Group Effect Random Effect 18 - 22
All Four 18 - 25
ANOVA for Anxiety at Baseline 18 - 27
ANOVA for Psychosocial Adjustment to illness at 3 months 18 - 28