Variables
Variables. 9/12/2013. Readings. Chapter 2 Measuring and Describing Variables (Pollock) (pp.32-33 ) Chapter 2 Descriptive Statistics (Pollock Workbook). Exam 1 9/19. Exam 1 9/19 In class exam. You do not need an exam book You can use a basic calculator.

Variables
E N D
Presentation Transcript
Variables 9/12/2013
Readings • Chapter 2 Measuring and Describing Variables (Pollock) (pp.32-33) • Chapter 2 Descriptive Statistics (Pollock Workbook)
Exam 1 9/19 • Exam 1 9/19 • In class exam. You do not need an exam book • You can use a basic calculator
Office Hours For the Week • When • Monday and Friday 10-12:00 • Tuesday 8-12 • And by appointment
Course Learning Objectives • Students will learn the basics of research design and be able to critically analyze the advantages and disadvantages of different types of design. • Students Will be able to interpret and explain empirical data.
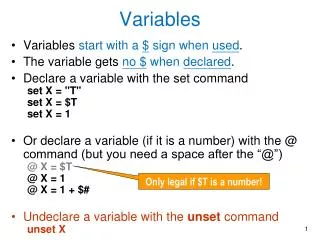
Variables • Measured Concepts • We need to operationalize concepts to test hypotheses • Concept- Conceptual Definition- Operational-Definition- Operationalization- Variable
Categorical Nominal Ordinal Name Provide value And Order • Name • And provide value
What makes them unique • The values matter • Your variable includes all possible values, not just the one’s that you assign. • Name, order, and the distances between values matter.
Interval Level Variables • The values matter at this level • The distances matter • The zero is arbitrary
Ratio Variables • The Full properties of numbers. • Its measurement on Steroids • A zero means the absence of a property • Classify, order, set units of distance
Descriptive Statistics • These simply describe the attributes of a single variable. • You cannot test here (you need two variables) • Why do them?
Categories of Descriptive Statistics Measures of Central Tendency Measures of Dispersion How wide is our range of data, how close to the middle are the values distributed Range, Variance, Standard Deviation • The most common, the middle, the average • Mean, Median and Mode
Frequency Distributions • This Provides counts and percentages (relative frequencies) of the values for a given variable • Computing a relative Frequency • The Cumulative Percent is percentage of observations less than or equal to the category • St. Edward’s Data
The Mode • the most frequent observation of the variable in a distribution • Which category is most common • There can be more than 1
Examples • What are the Modes here? • 110,105.100.100.100.100.99.98 • 110.105.105.105.100.95.95.95.90
Advantages and Disadvantages • Advantages of the Mode • Disadvantages of the Mode
Where Parties Should Go in A Normal Distribution They Move To the Center, why?
The Median • It only tells us one thing • 50% above, 50% below • the value that lies in the middle of the data when arranged in ascending order.
Examples • The University of Texas • The 78704 Zip Code
About the Median • Characteristics and problems of the median • The middle observation = (N+1)/2 • Three Examples • (133,113,112,95,94) • (27,12,78,104,45,34) • (105,102,101,92,91,80)
You can also look here for where 50% falls Finding the Median • location of median case (1747+1)/2 = 874 • Where Does that case fall? • Case 1 through 534 = has value of 0 • Case 535 through 1747 = has value of 1 • Case 874 is more than 535 and less than 1747 • THE MEDIAN IS 1, the category is voted
The Answer location of median case (1454+1)/2 = 727.5 Where Does that case fall? Cases 1 through 74 = has value of 1 Cases 75 through 502= has value of 2 Cases 503 through 1454= as a value of 3 Case 727.5 is more than 503 THE MEDIAN IS 3, the category is not at all scientific The 50% falls in here
The Mean • What is it • How do you compute it?
About the Mean • Characteristics of the Mean • Problems of the Mean