Essential Concepts in SPSS: Understanding Variables and Data Analysis Techniques
This study guide covers crucial concepts in SPSS, focusing on the operationalization of variables, types of data (nominal, ordinal, interval, ratio), and the importance of reliability and validity in research design. Students will learn how to create scales and indexes to simplify complex data, while also gaining competency in statistical analysis using SPSS. The guide outlines homework expectations, class participation, and the significance of understanding data types for effective research in social sciences.

Essential Concepts in SPSS: Understanding Variables and Data Analysis Techniques
E N D
Presentation Transcript
Variables 9/10/2013
Readings • Chapter 3 Proposing Explanations, Framing Hypotheses, and Making Comparisons (Pollock) (pp.48-58) • Chapter 1 Introduction to SPSS (Pollock Workbook)
Homework: Due 9/12 • Chapter 1 • Question 1 Parts A &B • Question 2 • Exam 1 9/19….. (study guide for Thursday)
About the Homework • It must be turned in during class. • It cannot be emailed • It must appear on the workbook paper (original or a photocopy) • You cannot:
Office Hours For the Week • When • Wednesday 10-12:00 • Thursday 8-12 • And by appointment
Course Learning Objectives • students will achieve competency in conducting statistical data analysis using the SPSS software program. • Students will learn the basics of research design and be able to critically analyze the advantages and disadvantages of different types of design.
A way of getting content validity Indexes and Scales
Why create a scale/index? • To form a composite measure of a complex phenomenon by using two or more items • Get at all facets • Simplify our data
Likert Scale • A common way of creating a scale • Advantages • Disadvantages
Guttman Scaling • Employs a series of items to produce a score for respondents • Ordering questions that become harder to agree with • Advantages and disadvantages
SPSS Statistical Package for the Social Sciences
What is a statistical package • Popular Versions • SPSS • SAS • R • Stata
Getting SPSS Don’t Do Use it on the machines on campus- free! Consider purchasing a 6-month license (52.00 + 4.99 download fee) • Purchase a student version • Limited functions • Limited variables • Searching the internet for a “free version” • You might get a virus • The Russians will steal your identity (exception fallacy).
How to Open Data files • Data Files on the Pollack CD • GSS2008.SAV- the 2008 General Social Survey Dataset • n=2023 • 301 variables • NES2008.SAV- the National Election Study from 2008. n=2323 • 302 variables • STATES.SAV- aggregate level data for the 50 States. N=50 • 82 Variables • WORLD.SAV- aggregate level data for the nations of the world. n=191 • 69 Variables
SPSS uses 2 windows • Data Editor Window • is used to define and enter your data and to perform statistical procedures. • very spread-sheet like • .sav extension • The Output Window • this is where results of statistical tests appear • This opens when you run your first test • .spv extension
It is like a spreadsheet • In Variable View • You define your parameters • Give variables names • Operationalize variables • We will not do a lot of this
Names and Labels Name Labels A longer definition of the variable These describe the actual variable • how the label appears at the top of the column (like the first row in excel) • you cant use dashes, special characters or start with numbers • These should represent the variable
Value Labels • This shows how variables are operationalized • Value= the numeric value given to a category • Label= the attribute of the concept
In Data View • You type in raw data • It looks very much like Excel • Rows= cases • Columns= Variables
How Things are Displayed Edit • Options • Display names • Alphabetical
Variables I Like Values and Labels
Exiting SPSS • If you changed the actual dataset you must save it • If you ran any statistics, you must save these as well
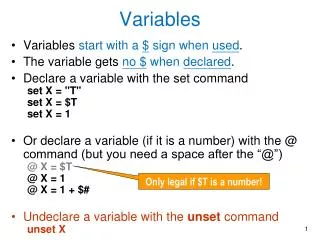
Variables • Measured Concepts • We need to operationalize concepts to test hypotheses • Concept- Conceptual Definition- Operational-Definition- Operationalization- Variable
Nominal Variables • Identify, label, and operationalize categories • Categories are • Exhaustive • Mutually Exclusive • Values are their for quantification only
Ordinal Variables • These identify, rank order, label, and operationalize categories • The Numbers mean something here • Operationalization denotes more or less of an attribute
What makes them unique • The values matter • Your variable includes all possible values, not just the one’s that you assign. • Name, order, and the distances between values matter.
Interval Level Variables • The values matter at this level • The distances matter • The zero is arbitrary
Ratio Variables • The Full properties of numbers. • Its measurement on Steroids • A zero means the absence of a property • Classify, order, set units of distance
Descriptive Statistics • These simply describe the attributes of a single variable. • You cannot test here (you need two variables) • Why do them?
Categories of Descriptive Statistics Measures of Central Tendency Measures of Dispersion How wide is our range of data, how close to the middle are the values distributed Range, Variance, Standard Deviation • The most common, the middle, the average • Mean, Median and Mode
Frequency Distributions • This Provides counts and percentages (relative frequencies) of the values for a given variable • Computing a relative Frequency • The Cumulative Percent is percentage of observations less than or equal to the category