r and R 2
240 likes | 382 Vues
r and R 2. What are they? When should I use them? How do Excel and GCs handle them? Why should I be careful with the Nulake text?. Matt Regan (et al) Department of Statistics The University of Auckland. r – little r – what is it?.

r and R 2
E N D
Presentation Transcript
r and R2 • What are they? • When should I use them? • How do Excel and GCs handle them? • Why should I be careful with the Nulake text? Matt Regan (et al) Department of Statistics The University of Auckland
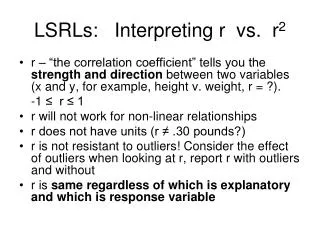
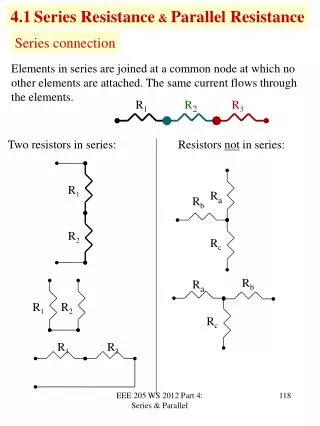
r – little r – what is it? • r is the correlation coefficient between y and x • r measures the strength of a linear relationship • r is a multiple of the slope
* * * * * * * * y * * * * * * * * * * * * x r – when can it be used? • Only use r if the scatter plot is linear • Don’t use r if the scatter plot is non-linear! r = 0.99
* * * r = 0.57 r = 0.99 * * * * * * * * * * * * * * * y * y * * * * * * * * * * * * * * * * * * * * * x x r– what does it tell you? • How close the points in the scatter plot come to lying on the line
* * * * * * * * * * * * * * * * * * y y * * * * * * * * * * * * * * * * * * * * * * x x R2 – big R2– what is it? • R2 is the coefficient of determination • Measures how close the points in the scatter plot come to lying on the fitted lineor curve
* * * * * * * * * * * * * * * * * * y y * * * * * * * * * * * * * * * * * * * * * * x x R2 – big R2– when can it be used? • When the scatter plot of y versus x is linear or non-linear
y Dotplot of the y’s Shows the variation in the y’s ˆ y x ˆ Dotplot of the y’s Shows the variation in the y’s ˆ x R2– what does it tell you?
ˆ Variation in the y’s: This amount of variation can be explained by the model ˆ y y ˆ Variation iny's Variation in fitted values = 2 = R Variation in y values Variation in y's x R2– what does it tell you? We see some additional variation in the y’s. The excess is not explained by the model.
R2 – what does it tell you? • When expressed as a percentage, R2 is the percentage of the variation in Y that our regression model can explain • R2near 100% model fits well • R2 near 0% model doesn’t fit well
* * * * * * * * * * y * * * * * * * * * * x R2 – what does it tell you? • 90% of the variation in Y is explained by our regression model. R2 = 90%
R2 – pearls of wisdom! • R2 and r 2 have the same value ONLY when using a linear model • DON’T use R2 to pick your model • Use your eyes!
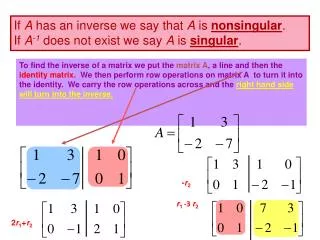
This straight line is called a regression line and we are required to calculate its equation. This is best done with a graphics calculator or spreadsheet programme on a computer. Regression Lines by Inspection You should only attempt to estimate a regression line if you do not have the technology available. 5.2 The Regression Line – p227
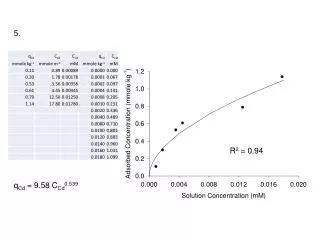
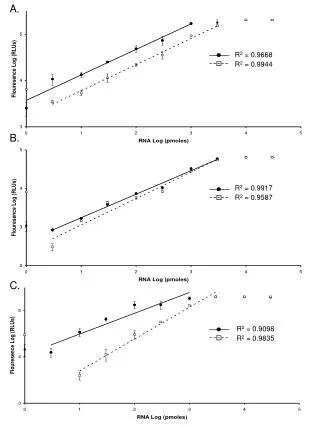
Non-linear Modelling EquationsIt is possible to use your calculator to find other regression equations other than a straight line. These non-linear models are also built into your calculator. If they result in a coefficient closer to 1 then they are more appropriate than the straight line regression equation. 5.2 The Regression Line – p229
Non-linear Regression ModelsIt is possible that the best model for some data is a non-linear regression line (e.g. a curve) such as an exponential or power function. All the technology aids (calculator and spreadsheets programmes) are able to model data with different models and by inspecting the correlation coefficient, the researcher should be able to determine the best model. 5.4 Non-linear Regression Models – p241
Modelling: Drawing Graphs and adding a Trendline using a Spreadsheet – page 337
Modelling: Drawing Graphs and adding a Trendline using a Spreadsheet – page 337
13 13 12 12 9 11 11 11 10 10 8 10 9 9 9 7 8 8 8 6 7 7 7 5 6 6 6 4 5 5 5 10 15 20 4 9 14 3 4 4 9 14 4 9 14 Correlation – What can go wrong?