r and R 2
130 likes | 344 Vues
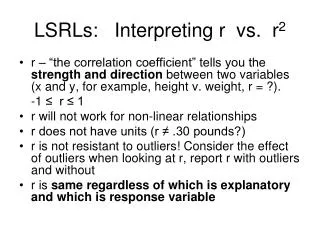
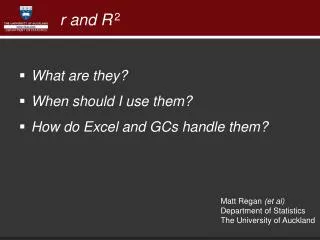
r and R 2. What are they? When should I use them? How do Excel and GCs handle them?. Matt Regan (et al) Department of Statistics The University of Auckland. r – little r – what is it?. r is the correlation coefficient between y and x

r and R 2
E N D
Presentation Transcript
r and R2 • What are they? • When should I use them? • How do Excel and GCs handle them? Matt Regan (et al) Department of Statistics The University of Auckland
r – little r – what is it? • r is the correlation coefficient between y and x • r measures the strength of a linear relationship • r is a multiple of the slope
* * * * * * * * y * * * * * * * * * * * * x r – when can it be used? • Only use r if the scatter plot is linear • Don’t use r if the scatter plot is non-linear! r = 0.99
* * * r = 0.57 r = 0.99 * * * * * * * * * * * * * * * y * y * * * * * * * * * * * * * * * * * * * * * x x r– what does it tell you? • How close the points in the scatter plot come to lying on the line
* * * * * * * * * * * * * * * * * * y y * * * * * * * * * * * * * * * * * * * * * * x x R2 – big R2– what is it? • R2 is the coefficient of determination • Measures how close the points in the scatter plot come to lying on the fitted lineor curve
* * * * * * * * * * * * * * * * * * y y * * * * * * * * * * * * * * * * * * * * * * x x R2 – big R2– when can it be used? • When the scatter plot of y versus x is linear or non-linear
y Dotplot of the y’s Shows the variation in the y’s ˆ y x ˆ Dotplot of the y’s Shows the variation in the y’s ˆ x R2– what does it tell you?
ˆ Variation in the y’s: This amount of variation can be explained by the model ˆ y y ˆ Variation iny's Variation in fitted values = 2 = R Variation in y values Variation in y's x R2– what does it tell you? We see some additional variation in the y’s. The excess is not explained by the model.
R2 – what does it tell you? • When expressed as a percentage, R2 is the percentage of the variation in Y that our regression model can explain • R2near 100% model fits well • R2 near 0% model doesn’t fit well
* * * * * * * * * * y * * * * * * * * * * x R2 – what does it tell you? • 90% of the variation in Y is explained by our regression model. R2 = 90%
R2 – pearls of wisdom! • R2 and r 2 have the same value ONLY when using a linear model • DON’T use R2 to pick your model • Use your eyes!
NOTE It is important for students to clearly understand the role of the explanatory/predictor variable and the response/predicted variable and to clearly distinguish them before starting any analysis. The explanatory/predictor variable is plotted on the horizontal axis of a scattergraph and the response/predicted variable on the vertical axis (in considering correlation only, the variables may be plotted on either axis).
When regressing y on x, a least squares regression line (which is the most commonly used form of regression) minimises the sum of the squares of the vertical distances of the points from the regression line (i.e. the residuals). Hence, it is only valid to estimate (predict) y (the response/predicted variable) from x (the explanatory/predictor variable).It is not valid to predict x from y – this would require x to be regressed on y and would result in a different regression equation.