Download
1 / 13
130 likes | 146 Vues
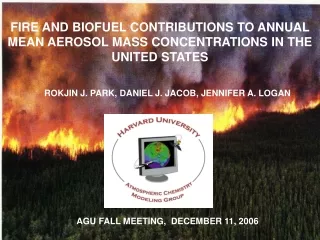
FIRE AND BIOFUEL CONTRIBUTIONS TO ANNUAL MEAN AEROSOL MASS CONCENTRATIONS IN THE UNITED STATES. ROKJIN J. PARK, DANIEL J. JACOB, JENNIFER A. LOGAN AGU FALL MEETING, DECEMBER 11, 2006. [ Westerling et al., 2006]. [Soja et al., 2006].

E N D
FIRE AND BIOFUEL CONTRIBUTIONS TO ANNUAL MEAN AEROSOL MASS CONCENTRATIONS IN THE UNITED STATES ROKJIN J. PARK, DANIEL J. JACOB, JENNIFER A. LOGAN AGU FALL MEETING, DECEMBER 11, 2006
[Westerling et al., 2006] [Soja et al., 2006] OBSERVED TREND IN WILDFIRE FREQUENCY AND AREA BURNED IN NORTH AMERICA THE IMPORTANCE OF FIRE FOR U.S. AIR QUALITY WILL INCREASE IN THE FUTURE AS U.S. ANTHROPOGENIC EMISSIONS DECREASE.
OBJECTIVE AND METHODS QUANTIFY THE MORE DIFFUSE AND NATIONWIDE EFFECTS OF BIOMASS BURNING (WILDFIRES, OTHER FIRES, RESIDENTIAL BIOFUEL AND INDUSTRIAL BIOFUEL) ON SEASONAL AND ANNUAL AEROSOL CONCENTRATIONS IN THE U.S. FOR 2001-2004 [TC]BM = ε(TC / K)BM × [ns-K]OBS, [ns-K] ≡ [K] – 0.6 × [Fe], TC ≡ OC + EC where ε = emission ratio from biomass burning and 0.6 = mass ratio of K/Fe measured on coarse aerosols (Malm et al., 1994) • Use the seasonal variation of ns-K concentrations and satellite fire data to segregate different types of burning contributions • ε(TC / K)BM ranges from 10 TO 110 (Andreae and Merlet, 2001) • Use correlation statistics between TC and ns-K aerosol concentrations from the nationwide IMPROVE network to compute enhancement ratios from fires ε(TC / K)FIRE ≈ d[TC] / d[ns-K] • Use emission ratios of 100 for residential biofuel burning (Fine et al., 2001) and of 10 for industrial biofuel burning (U.S. EPA, 2001)
Interagency Monitoring of PROtected Visual Environments (IMPROVE) network Sites > 150 in 2001 • Started in 1987 to monitor visibility degradation in Federal Class I areas (large national parks and wilderness areas) • Measure 24-h speciated aerosol mass concentrations every third day including organic carbon (OC),elemental carbon (EC), potassium (K), iron (Fe).
[TC] ≡ [OC] + [EC] MONTHLY MEAN TC CONCENTRATIONS AVERAGED AT CONTIGUOUS U.S. IMPROVE SITES FOR 2001-2004 TC (μg C m-3) SUMMERTIME TC CONCENTRATIONS ARE HIGHEST DUE TO FIRES AND SOA AND MORE VARIABLE THAN VALUES IN WINTER. SOA VARIABILITY IS NOT EXPECTED TO BE THIS LARGE (Palmer et al., 2006)
DRY MASS BURNED IN NORTH AMERICA FOR JUNE-AUGUST, 2001-2004 van der Werf et al., 2006
2001 2004 Background ns-K MONTHLY MEAN ns-K CONCENTRATIONS FOR 2001-2004 East West • Background ns-K concentrations are computed by taking averages of the lowest three monthly mean concentrations over 2001-2004 to minimize other burning influences. • Summer ns-K in excess of background represents summer wildfire contributions. • For other fires we use monthly gridded satellite fire data to constrain time and location of open burnings. • Remaining ns-K represents residential biofuel contributions.
DERIVED d[TC]/d[ns-K] ENHANCEMENT RATIOS FROM WILDFIRES FOR JUN-AUG, 2001-2004 SITES WITH R ≥ 0.7 (μg C m-3 / μg m-3) VALUES ARE GENERALLY HIGHER IN THE NORTHERN U.S. WHERE MOST OF THE BURNING IS OF FOREST, THAN IN THE SOUTH, WHERE BURNING OF BRUSH AND GRASSLAND DOMINATES.
WILDFIRE CONTRIBUTIONS TO TC AEROSOL CONCENTRATIONS IN THE SUMMERS OF 2001-2004 [TC]WILDFIRE = d[TC]/d[ns-K] × ([ns-K]SUMMER-[ns-K]BACKGROUND) • USE RATIOS AT SITES WITH R ≥ 0.7 FOR A SPECIFIC YEAR • AT SITES WITH R < 0.7, USE VALUE AVERAGED OVER SITES WITH R ≥ 0.7 IN EACH STATE FOR A SPECIFIC YEAR • IF NO SINGLE SITE WITH R ≥ 0.7IS AVAILABLE WITHIN STATE, USE AVERAGE OF OTHER YEAR VALUES FOR THAT STATE. TC ( μg C m-3) • HIGHEST WILDFIRE CONTRIBUTIONS ARE FOUND IN THE WESTCOAST WHERE 2002 IS HIGHEST. • IN THE NORTHEAST, TC CONCENTRATIONS ARE MOSTLY DUE TO TRANSBOUNDARY TRANSPORT FROM CANADIAN WILDFIRES.
FIRE AND BIOFUEL CONTRIBUTIONS TO ANNUAL TOTAL CARBON AEROSOL CONCENTRATIONS Wildfires are the most important contributor to TC aerosol concentrations in the west while prescribed burns and residential biofuel are equally important in the east.
ANNUAL MEAN BIOMASS BURNING AEROSOL CONCENTRATIONS IN THE UNITED STATES FOR 2001-2004 Annual mean concentrations of fine aerosols from biomass burning are 1.2 and 1.6 μg m-3 in the west and the east, respectively, accounting for 30% (west) and 20% (east) of observed total fine aerosol concentrations and represent a significant increment toward the NAAQS for annual mean concentrations of fine aerosols (15 μg m-3).
CONCLUSIONS • The year-to-year variation of summer wildfires largely drives the observed interannual variability in TC aerosol concentrations in the United States. • Wildfires are the most important contributor to annual concentrations of TC aerosol in the west while prescribed burns and residential biofuel are equally important in the east. • Our estimates of annual mean contributions from biomass burning are 0.68 and 0.95 μg C m-3 in the west and the east, accounting for about 50% of observed annual mean TC concentrations. • Annual mean concentrations of fine aerosols from biomass burning are 1.2 and 1.6 μg m-3 in the west and the east, respectively, accounting for 30% (west) and 20% (east) of observed total fine aerosol concentrations. • Fire and biofuel contributions to annual aerosol concentrations represent a significant increment toward the NAAQS for annual mean concentrations of fine aerosols (15 μg m-3 ).
CORRELATION STATISTICS BETWEEN TC AND ns-K AEROSOL CONCENTRATIONS FOR JUNE-AUGUST, 2004 REGRESSION SLOPE AT SITES (R ≥ 0.7) R SITES IN MONTANA SITES IN NEW MEXICO TC (μg C m-3) HIGH SLOPE INDICATES SIGNIFICANT BOREAL WILDFIRE INFLUENCES.