FEMA Region III Storm Surge Project
130 likes | 312 Vues
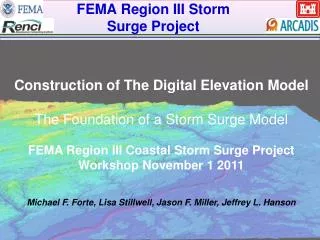
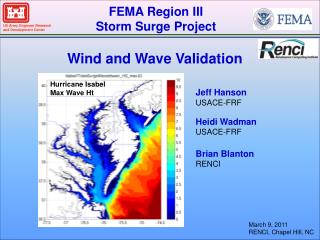
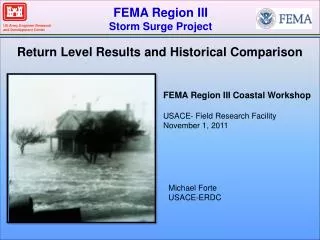
FEMA Region III Storm Surge Project. Return Level Results and Historical Comparison. FEMA Region III Coastal Workshop USACE- Field Research Facility November 1, 2011. Michael Forte USACE-ERDC. Advancements. 2010 Finite Grid 30-40m Minimum Resolution. 1978 Triangular Finite Grid

FEMA Region III Storm Surge Project
E N D
Presentation Transcript
FEMA Region III Storm Surge Project Return Level Results and Historical Comparison FEMA Region III Coastal Workshop USACE- Field Research Facility November 1, 2011 Michael Forte USACE-ERDC
Advancements 2010 Finite Grid 30-40m Minimum Resolution 1978 Triangular Finite Grid 5-10km resolution
FEMA Tropical & Extratropical 100yr Return Levels • Delaware Bay, Eastern Shore of VA • and Southern Chesapeake Bay • (Norfolk & Tidewater VA) • contain the highest surge levels • throughout Region III. • Lowest return levels at Middle • Chesapeake Bay All UNITS ARE IN US FEET
100Yr Historical Return Levels Still Water Elevation (SWEL) Compiled by Dewberry from multiple Flood Insurance Studies throughout Region III Sources: USACE – Potomac (DC area) VIMS – Majority of Chesapeake Bay NWS- Hydro (Gauge analysis) USGS – (WL Gauge analysis) Grenier Engineering (WLGauge analysis) Compare existing/historical with Region III 100yr results
100Yr SWEL Comparison FEMA R3 minus Historical • Majority of values +/- 1 foot when • Compared to Historical Study • Elevated Return Levels in Delaware • Bay and Lower Chesapeake (Norfolk) • (+ 1.5 – 3.5 ft) • Decreased Return Levels in upper • Chesapeake Bay and VA Eastern Shore • (- 1.5 – 3.5ft) • Overall good agreement with a couple of important differences
SWEL Comparison Scatter Plot of Region III and Historical SWEL values
Why the changes? • Storm track • Historical gauge analysis • Historical Studies for Delaware Bay • were based on gauge analysis with very few to no tropical systems occurring. • Tropical Storm tracks –winds drive • water South down the Chesapeake Bay • Delaware Bay acts as a catch basin • with few tributaries allowing water • to pile up.
Why the changes? • Storm track • Historical gauge analysis • Historical Studies for Delaware Bay • were based on gauge analysis with very few to no tropical systems occurring. • Tropical Storm tracks –winds drive • water South down the Chesapeake Bay • Delaware Bay acts as a catch basin • with few tributaries allowing water • to pile up.
Why the changes? • Storm track • Historical gauge analysis • Historical Studies for Delaware Bay • were based on gauge analysis with very few to no tropical systems occurring. • Tropical Storm tracks –winds drive • water South down the Chesapeake Bay • Delaware Bay acts as a catch basin • with few tributaries allowing water • to pile up.
Region II & Region III 100Yr Level Comparison Region II 100Yr Modeled Output Region II Modeled output compared With Region III
Region II & Region III 100Yr Level Comparison Another Encouraging Result! • Majority of points are within +/- 1 foot. • Two modeled outputs from two • different teams, run on two different computers = VERY GOOD • AGREEMENT
FEMA Region III Storm Surge Project Summary/Conclusions • Excellent agreement with historical SWELS with a few important differences • Region II Compares well with Region III