Download
1 / 15
160 likes | 332 Vues
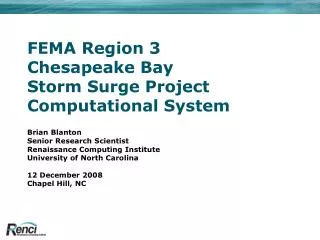
FEMA Region 3 Chesapeake Bay Storm Surge Project. Brian Blanton Senior Research Scientist Renaissance Computing Institute University of North Carolina 11 August 2008 USACE Norfolk District. RENCI Objective.

E N D
FEMA Region 3Chesapeake BayStorm Surge Project Brian Blanton Senior Research Scientist Renaissance Computing Institute University of North Carolina 11 August 2008 USACE Norfolk District
RENCI Objective • Extend/augment an existing modeling system into the Chesapeake Bay/Region III geographic area in order to compute of tropical and extra-tropical storm-induced water levels • Model grids, DEM • Incorporate STWAVE nearshore wave model into computational system • Coordinate our work with the USACE and partners for data preparation and output data management, grid generation, storm and wind characterization, and wave model integration. • I.e. : Communicate as much of our experience in the North Carolina Floodplain Mapping Project (NCFMP) as possible.
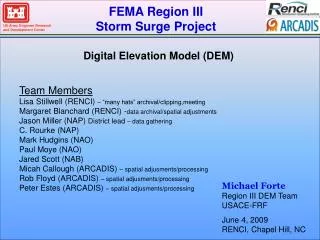
Three primary RENCI Phase 1 Tasks • Task 1 – Assembly of Digital Elevation Model • UNC/IMS, Luettich • Existing topo/bathy data into larger consistent DEM • NCFMP has identified potential issues regarding data quality, bathymetric data, etc. • Task 2 – Grid Development and Modeling Consultation (UNC/IMS-Luettich) • Task 3 – Extend Computational System (RENCI/Blanton)
RENCI Personnel Involved • RENCI • Dr. Brian Blanton : Coastal Oceanographer, Computational Scientist • Margaret Blanchard : GIS/GRASS expert • Dr. Scott Madry : Geospatial Sciences • Ken Galluppi : Management • Howard Lander : Research Programmer • UNC Institute of Marine Sciences • Dr. Rick Luettich : Coastal Oceanographer, ADCIRC Developer • Crystal Fulcher : SMS/ADCIRC grid development
NCFMP Overview • RENCI/UNC + Collaborators • Develop DEM • Build grids • Develop tropical storm statistics (JPM-OS) and tracks • Execute validation simulations • Build computational system (similar to Gulf/LACRR system) • Execute probabilistic tropical and extratropical storms • Post-simulation statistical analysis (development of flood-frequency curves from simulations + JPM-OS storm weights)
21st Century Data– Statewide Elevation Courtesy: J. Dorman, NCEM Hillshaded Relief of North Carolina Statewide LiDAR Derived Elevation
Digital Elevation Model (RENCI/Madry) • Combine recent LIDAR and bathymetric data sources into a seamless 10-meter DEM for coastal NC. Data Sources/Patching Resulting 10-m DEM
ADCIRC Grid for Coastal NC Inundation • 350K nodes, 10-20 meter nearshore, upland resolution
ADCIRC Grid Detail • Grid (triangles) in Wrightsville Beach Area • Try to align grid “lines” with coastline • 20-30 meter beach resolution
Physical System • Computation of StillWater ELevation and wave SETUP component to total water level due to probabilistic Tropical and ExtraTropical systems. • Numerical Models for different parts of the total water level
NCFMP Computational System WaveWatch III for oceanic wave field Wind/Pressure Simulator HBL, WRF, NHC track etc Wave Force Water level SWAN for nearshore wave field and radiation stress ADCIRC for SWEL+Setup
Statistical Storm Track Model (Vickery et al) • Historical Tracks • 20 hurricanes in 67 years (1940-2007) • Annual Occurrence Rate = .338 • Modeled Tracks • 324 parameter combinations (i.e. tracks/weights) for both Landfalling/Bypassing • 27 Stalling storms (675 total) • Each storm weighted by probability of occurrence from parameter distributions/Joint Probability Method • Uniform Landfall/Bypass Distribution
NCFMP Computational Effort • 324 individual simulations, each with a probability of occurrence (Weighting from Joint Probability Method) • Each simulation takes about 12-16 hours on RENCI’s IBM BlueGene/L • 256 processors per sim, 10-12 simultaneous simulations • 1.2 million cpu-hours Total Surge = Stillwater + Wave Setup ADICRC+SWAN Wave Setup Contribution SWAN
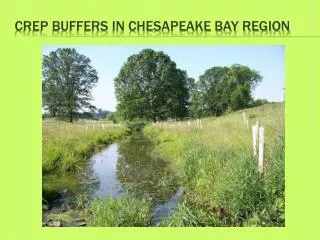
Chesapeake Bay/Region III • DEM/grid development • Iterative process between grid and validation simulations, as well as QA/QC process • Time-consuming, labor intensive • Storm statistics development • More Extratropical than NC • Computational system used for validation runs • Embed STWAVE into workflow • Identification of computational resources • Website/Database