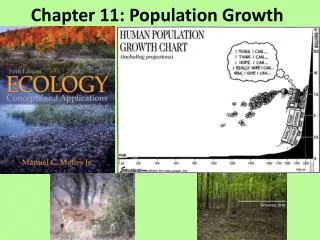
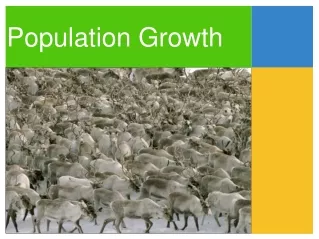
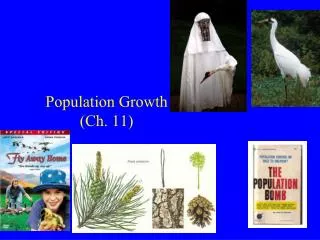
Population Growth (Ch. 11)
Population Growth (Ch. 11). Population Growth. 1) Geometric growth 2) Exponential growth 3) Logistic growth. Geometric Growth. Growth modeled geometrically Resources not limiting Generations do not overlap. Recall: 1) = N t+1 / N t 2) = R o. Geometric Growth.

Population Growth (Ch. 11)
E N D
Presentation Transcript
Population Growth • 1) Geometric growth • 2) Exponential growth • 3) Logistic growth
Geometric Growth • Growth modeled geometrically • Resources not limiting • Generations do not overlap • Recall: • 1) = Nt+1 / Nt • 2) = Ro
Geometric Growth • Growth modeled geometrically • Resources not limiting • Generations do not overlap • Equation: Nt = No t • Nt = Number inds. @ time t • No = Initial no. inds. • = Geometric rate of increase • t = Number time intervals
Geometric Growth • Phlox (annual plant) Fig. 11.3
Exponential Growth • Growth modeled exponentially • Resources not limiting • Generations overlap • Recall: • Per Capita Rate of Increase (r) • r = (ln Ro) / T • r = b – d
Exponential Growth • Equation: dN / dt = rmax N • dN / dt means “change in N per unit time” • Recall r: per capita rate of increase (Ch. 10) • rmax: Special case of r (intrinsic rate of increase). b - d under optimum conditions • b = birth rate and d = death rate (rates per individual per unit time) • As N increases, dN/dt gets larger.
Geo: Nt = No t Exponential Growth • For exponential growth: Nt = N0 ermaxt • Nt = No. inds. at time t. • N0 = Initial no. inds. • e = Base natural logarithms • rmax = Intrinsic rate of increase • t = Number time intervals • Resources not limiting
Exponential Growth: Example • Whooping crane
Exponential Growth: Example • Hunting/habitat destruction • Federally listed Endangered(1967). Down to 22!! Fig. 11.6
Exponential Growth: Example • Raising birds: costumes avoid imprinting on humans
Exponential Growth: Example • Teaching young birds to migrate (Wisconsin to Florida) 1996
Geometric or Exponential? Nt = No t Nt = N0 ermaxt
Geometric or Exponential? Nt = No t Nt = N0 ermaxt
Logistic Population Growth • Unlimited resources?? nothing lasts forever… • As resources depleted: logistic population growth.
Logistic Population Growth • As resources depleted, logistic population growth (generations overlap) • Sigmoid (S-shaped) curve. • Carrying capacity (K): number environment can support. Fig. 11.8 Ex
Logistic Population Growth • Yeast growth (limited alcohol) • Max. 17% (34 proof) Fig. 11.9
Logistic Population Growth Equation:dN/dt = rmax N (1-N/K) • rmax = Intrinsic rate of increase (ideal conditions) • N = population size @ time t • K = carrying capacity • Or: dN/dt = rmax N (K-N) K
How does this work? • dN/dt = rmax N (K-N) K • N small: rmax N (K-0) or ≈ rmax N (1) K At small N, acts like exponential growth! • N big: rmax N (K-K) or ≈ rmax N (0) K At larger N, growth slows: stops at K
Logistic Population Growth 1-N/K is “scaling factor” When N nears K, dN/dt nears zero. Fig. 11.13
Logistic Population Growth dN/dt = rmaxN (1-N/K) • r: actual (realized) reproductive rate (b-d) • Max. @ small N • When N=K, r=0 • So b=d and b-d=0 • Above K? r negative Fig. 11.14
Concepts! • Population growth (# added per unit time) highest when N=K/2 • Maximum sustainable yield: largest sustainable harvest
Concepts! • N/K: reflects environmental resistance • Factors that limit population size Environmental resistance • Density-dependent factors: depend on density (N/K) • Disease, Resource competition • Density-independent factors: not related density • Natural disasters (hurricane, fire, flood) dN/dt = rmaxN (1-N/K)
Organism Size and Population Density • A search for patterns…… • Size vs. density (neg. correlation) • Generation time vs. size? Size Gen time
Generation time vs. size • Positive correlation • Log-log scale rmax size vs. rmax? Size
rmax vs. size • Negative correlation • Note log:log scale
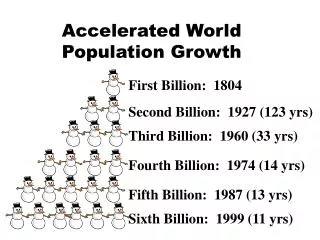
Human Population • How many? • Where? • Age distributions and growth potential How many?
Human Population • How many? • 7.09 billion (6/17/13) • 7.02 billion (6/11/12) • 6.925 billion (6/19/11) • 6.448 billion (6/18/05) • Check it out now at: • http://www.census.gov/ipc/www/idb/worldpopinfo.php Where (continent)?
Human Population • Where? Fig. 11.23 Fig. 11.22
Human Population • Where?
Human Population • Age distributions and growth potential, 2008 Fig. 11.24
Human Population • “Population bomb”: potential of population to explode as people age 2000/2001-Present - New Silent Generation or Generation Z 1980-2000 - Millennials or Generation Y 1965-1979 - Generation X 1946-1964 - Baby Boom 1925-1945 – Silent Generation 1900-1924 – G.I. Generation
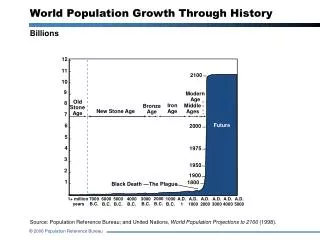
Human Population • Human pop. curve: shape? • What Earth’s K for humans?
Human Population • Depends in part on lifestyle! • Ecological footprint: resource use • Biocapacity: resource supply • Deficit if use>supply: US largest deficit
Course sequence • Natural history (Done!) • Individuals (Done!) • Populations (Done! Except Life Histories) • Species interactions (You are here!) • Communities/ecosystems • Geographic/global ecology
5 main types of interactions among species: Effect on Effect on Type of interaction species A species B Competition - - Predation + - Parasitism + - Commensalism + 0 Mutualism + +
Competition (Ch. 13) • Definition: • Individuals attempt to gain more resource in limiting supply • (-,-) interaction: both participants get less • Intraspecific: Within species. • Interspecific: Between species.
Competition • Interference Competition: • Individuals interact with each other • Resource (Exploitation) Competition: • Individuals interact with resource