Download
1 / 14
140 likes | 278 Vues
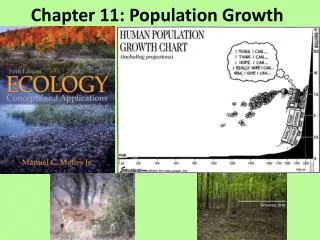
This chapter explores various models of population growth: geometric, exponential, and logistic. Geometric growth models populations with non-overlapping generations, where each generation size increases by a constant ratio. Exponential growth reflects overlapping populations at maximal rates, represented by continuous size changes over time. Logistic growth introduces environmental limitations, marked by carrying capacity (K), leading to a sigmoidal growth curve. Understanding these models provides insight into factors affecting population dynamics and the concept of density-dependent and density-independent factors.

E N D
Modeling Geometric Growth • Geometric growth represents maximal population growth among populations with non-overlapping generations • Successive generations differ in size by a constant ratio • To construct a model for geometric population growth, recall the formula for geometric rate of increase: = Nt+1 Nt • e.g., geometric rate of increase for Phlox: = 2408 = 2.4177 996 • To determine the growth of a non-overlapping population: by multiply by the size of the population at each beginning generation
Geometric growth for a hypothetical population of Phlox: • Initial population size = 996 • Number of offspring produced by this population during the year: N1 = N0 x or 996 x 2.4177 = 2408 • Calculating geometric growth from generation to generation: Nt = N0 x t Where, Nt is the number of individuals at time t; N0 is the initial population size; is the geometric rate of increase; t is the number of generations
Modeling Exponential Growth • Overlapping populations growing at their maximal rate can be modeled as exponential growth: dN/dt = rN • The change in the number of individuals over time is a function of r, the per capita rate of increase (a constant), times the population size (N) which is variable • Recall that we can interpret r as b – d; also, we can calculate r using the following formula: lnR0/T • To determine the size of the exponentially growing population and any specified time (t): Nt = N0 ert • Where, e is a constant; the base of the natural logarithms, r is the per capita rate of increase, t is the number of time intervals
Exponential Growth in Nature Example: Scots pine • Bennett (1983) estimated population sizes and growth of postglacial tree populations by counting pollen grains from sediments (e.g., pollen grains/meter2/year) • Assumption of this method? • Results: populations of the species grew at exponential rates for about 500 years
Logistic Population Growth • Environmental limitation is incorporated into another model of population growth called logistic population growth; characterized by a sigmoidal growth curve • The population size at which growth has stopped is called carrying capacity (K), which is the number of individuals of a particular population that the environment can support
What causes populations to slow their rates of growth and eventually stop growing at carrying capacity? • A given environment can only support a certain number of individuals of a species population • The population will grow until it reaches some kind of environmental limit imposed by shortage of food, space, accumulation of waste, etc.
Logistic Growth Equation • Logistic growth equation was proposed to account for the patterns of growth shown by populations as the begin to use up resources: dN/dt = rmN (K-N/K) • where, rm is the maximum per capita rate of increase (intrinsic rate of increase) achieved by a population under ideal conditions • Rearranged equation:
Thus, as population size increases, the logistic growth rate becomes a smaller and smaller fraction of the exponential growth rate and when N=K, population growth stops • The N/K ratio is sometimes called the “environmental resistance” to population growth • As the size of a population (N) gets closer and closer to K, environmental factors increasingly affect further population growth
The realized per capita rate of increase [r = rm N(1-N/K)] depends on population size • When N is small, r approximates rm • As N increases, realized r decreases until N = K; at that point realized r is zero
Limits to Population Growth: Density Dependent vs. Density Independent Factors • Density dependent factors Birth rate or death rate changes as a function of population density • Density independent factors Same proportion of individuals are affected at any density