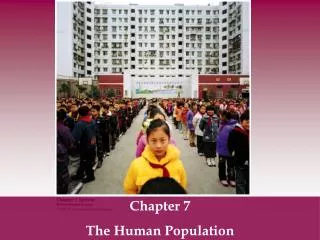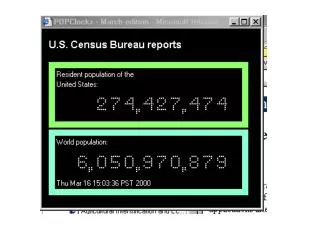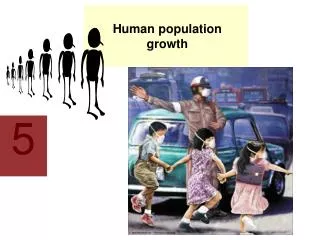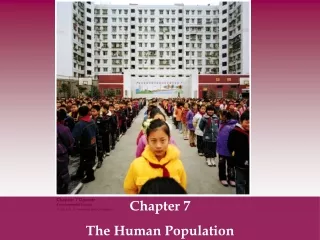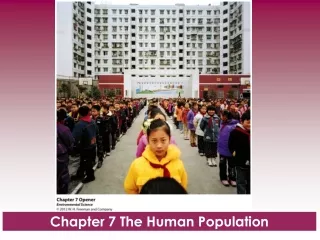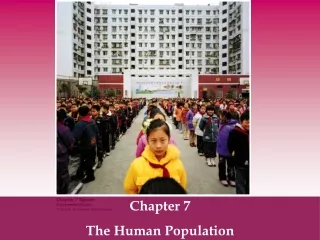
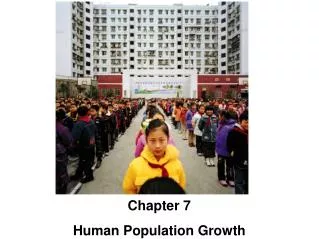
Chapter 7 Human Population Growth
Chapter 7 Human Population Growth. Scientists Disagree on Earth ’ s Carrying Capacity. Figure 7.1. Scientists Disagree on Earth ’ s Carrying Capacity. The following graphs show theoretical models of food supply and population size. Scientists Disagree on Earth ’ s Carrying Capacity.

Chapter 7 Human Population Growth
E N D
Presentation Transcript
Chapter 7 Human Population Growth
Scientists Disagree on Earth’s Carrying Capacity The following graphs show theoretical models of food supply and population size.
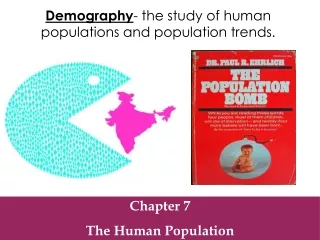
Human Population Growth • Demography: the study of human populations and population trends.
Many Factors Drive Human Population Growth • Changes in population size • Fertility • Life expectancy • Age structure • Migration
Changes in Population Size • Immigration: the movement of people into a country • Emigration: the movement of people out of a country.
Changes in Population Size • Crude birth rate (CBR): the number of births per 1000 individuals per year. • Crude death rate (CDR): the number of deaths per 1000 individuals per year.
Changes in Population Size • Global population growth rate = [CBR – CDR] ÷ 10 = growth rate in % [20 – 8] ÷ 10 = 1.2 percent
Doubling time: the number of years it takes a population to double. • For example: a population doubles every 40 years (40y), and begins with 25 million (mil.) people. After 80 years the population will double twice to 500 million, or 125 mil. → 40y → 250 mil. → 40y → 500 mil. Changes in Population Size
Changes in Population Size • The rule of 70 may be used to approximately calculate the doubling time (DT) in years. DT ≈ 70 ÷ percent annual growth rate
Changes in Population Size • Using the rule of 70, a population growing 2% per year will double approximately every 35 years. 70 ÷ 2 ≈ 35years
Fertility • Total fertility rate (TFR): an estimate of the average number of children that each woman in a population will bear. • Replacement level fertility: the total fertility rate required to offset the average number of deaths in a population and for the current population size to remain stable.
Fertility • Developed countries: countries with relatively high levels of industrialization and income. TRF is typically 2.1. • Developing countries: countries with relatively low levels of industrialization and income of less that $3 per person per day. TFR is usually greater than 2.1 to attain replacement level fertility.
Life Expectancy • Life expectancy: the average number of years that an infant born in a particular year in a particular country can be expected to live, given the current average life span and death rate of that country.
Life Expectancy • Infant mortality rate: the number of deaths of children under 1 year of age per 1000 live births. • Child mortality rate: the number of deaths of children under age 5 per 1000 live births.
Age Structure • Age structure diagrams: visual representations of age structure within a country for males and females.
Migration • A country may experience a change in population due to migration. • Net migration rate: the difference between immigration and emigration in a given year per 1000 people in a country.
Demographic Transition Many nations go through a demographic transition.
The Demographic Transition • The theory of the demographic transition suggests that as a country moves from a subsistence economy to industrialization and increased affluence, it undergoes a predictable shift in population growth.
The Four Stages of the Demographic Transition • Phase 1:Slow population growth because there are high birth rates and high death rates that offset each other. • Phase 2:Rapid population growth because birth rates remain high but death rates decline due to better sanitation, clean drinking water, increased access to food and goods, and access to health care.
The Four Stages of the Demographic Transition • Phase 3:Stable population growth as the economy and educational system improves and people have fewer children. • Phase 4:Declining population growth because the relatively high level of affluence and economic development encourage women to delay having children.
Family planning: the regulation of the number or spacing of offspring through the use of birth control. • As more women become better educated, the TFR tends to drop. Family Planning
Population size and consumption interact to influence the environment.
The Relationship between Economic Development and Population Growth Rate for Developing Nations
Ecological Footprints • Affluence: having a lot of wealth such as money, goods, or property. It is created by economic opportunity. • The per capita ecological footprint is a measure of affluence.
The IPAT Equation • To estimate the impact of human lifestyles on Earth we can use the IPAT equation: Impact = Population Affluence Technology
Ecological Footprints • Affluence:having a lot of wealth such as money, goods, or property. It is created by economic opportunity. • The per capita ecological footprint is a measure of affluence. • Urban populations have grown, and while they represent one-half of the world’s population, they consume three-fourths of the resources.
The Impact of Affluence • Gross domestic product (GDP): the value of all products and services produced in a year in that country. • GDP is made up of consumer spending, investments, government spending, and exports minus imports. • A countries GDP often correlates with its pollution levels.
Sustainable development is a common, if elusive, goal • Economic development has had a strong influence on a society’s impact on the environment.
Sustainable development is a common, if elusive, goal • Ecosystem stability will be threatened if global consumption patterns continue. • While alterations to ecosystems can improve human welfare, by bringing clean drinking water and food to people, the same changes make poverty worse for others.
Sustainable development is a common, if elusive, goal • If we improve sustainability, the standard of living may improve for a large number of people.
Review Questions 1. What determines the carrying capacity of an environment? 2. How do humans differ from other organisms in terms of carrying capacity? 3. Can we determine the carrying capacity of Earth for humans from data now available?
Review Questions 4. Distinguish immigration from emigration. 5. Define Crude Birth Rate. 6. What is meant by the doubling time of a population?
Review Questions 7. If a country had a population of 30 million people in 2010, and a doubling time of 40 years, what would the population be after 80 years has passed? 8. What is TFR? 9. What is replacement-level fertility?
Review Questions 10. Why is replacement-level fertility around 2.1 children in developed countries? Why isn’t it 2.0 children? 11. What is the definition of a developing country? 12. What is infant mortality? 13. An age structure diagram that is wider at the bottom than the top is called a _________ ________ (two words).
Review Questions 14. How many stages are there in the Demographic Transition Model? 15. In which phase does population decline? 16. What are the main factors influencing human population growth? 17. Describe the IPAT equation, and explain what it means.
Review Questions 18. What is the difference between economic development and sustainable development? 19. What factors make sustainable development difficult to achieve?