Global Human Population Growth Analysis: Past, Present, and Future Trends
220 likes | 269 Vues
Explore the factors influencing global population growth over time, from historical observations to modern innovations shaping Earth's carrying capacity. Discover demographic transitions and key metrics like fertility rates, life expectancy, and migration patterns.

Global Human Population Growth Analysis: Past, Present, and Future Trends
E N D
Presentation Transcript
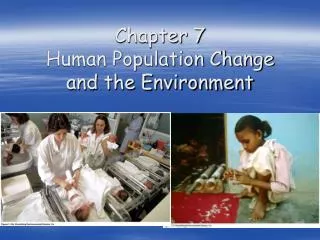
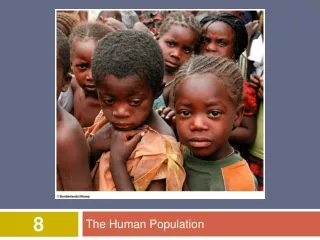
Chapter 7 The Human Population
Set up a graph like this to use with the data on the following slide orB.G.(before )
Global Population Growth At the present rate, the global human population increases by roughly a million lives every 5 days: 1.8 million babies are born and 800,000 people die. Figure 7.1
Global Population Growth The 12 Most Populous Countries in the World
Think and Write(We already did this as an exercise in class) • What are some limiting factors to life on Earth? (How many people do you think it can support?) • How have humans extended average life spans? – (longer lives & lower infant mortalities) • How have humans increased the ability of our planet to support life?(to exceed limits of natural resources) • Why is population an environmental issue? • What are some ways of limiting population? • What are some controversies of limiting population?
Earth’s Carrying Capacity • In 1798, Thomas Malthus observed that the human population was growing exponentially, while the food supply we rely on was growing linearly. He predicted that eventually, human population size would exceed the food supply. • Today, many scientists argue that the growing population of humans provides an increasing supply of intellect that leads to increasing amounts of innovation. • By using creativity, humans can alter Earth’s “carrying capacity”. This is one of the fundamental ways in which humans differ from most other species on Earth.
Innovation Population Agricultural Revolution • Around 8,000 years ago, humans transitioned from “hunting and gathering” to being able to grow their own food. This allowed communities to be more efficient with their time and efforts – increasing their ability to feed a larger population. Industrial Revolution • In the 1800’s, the use of fossil fuels enabled manufacturing to increase production capacity that would affect all human needs: food, medicine, housing, clothing, etc. Health and sanitation lowered death rates – increasing population.
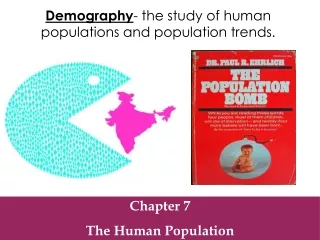
Factors that Drive Human Population Growth The next several slides address “demography” - the study of human populations and population trends. In this order: • Changes in Population Size • Fertility • Life Expectancy • Age Structure • Migration
Changes in Population Size • Immigration- the movement of people into a country • Emigration- the movement of people out of a country. • Net migration rate- the difference between immigration and emigration in a give year per 1,000 people in the country.
Changes in Population Size • Crude birth rate (CBR)= the number of births per 1,000 individuals per year. • Crude death rate (CDR)= the number of deaths per 1,000 individuals per year.
Examples from p.182 in textbook Changes in Population Size • Global population growth rate = (CBR - CDR) / 10 • National population growth rate = (CBR + immigration) - (CDR + emigration) / 10 • Doubling time “rule of 70” = 70/growth rate
Fertility • Total fertility rate- an estimate of the average number of children that each woman in a population will bear. • Replacement level fertility- the total fertility rate required to offset the average number of deaths in a population and for the current population size to remain stable. • Developed countries- (countries with relatively high levels of industrialization and income) avg: replacement-level fertility of 2.1 • Developing countries- (low levels of industrialization and income of less that $3 per day).Higher mortality among young people needs a TFR > 2.1 for replacement-level fertility.
Life Expectancy (end of life) • Life expectancy- the average number of years that an infant born in a particular year in a particular country can be expected to live. (given the current average life span and death rate of that country) Life expectancy is generally higher in countries with better health care. A high life expectancy also tends to be a predictor of high resource consumption rates and environmental impacts.
Life Expectancy (birth rate) • Infant mortality rate- the number of deaths of children under 1 year of age per 1,000 live births. • Child mortality rate- the number of deaths of children under age 5 per 1,000 live births. Countries with low life expectancy and high infant mortality rate, it is likely that the country’s population does not have sufficient health care or sanitation and that potable drinking water and food are in limited supply.
Age Structure Diagrams • Population pyramid: An age structure diagram that is widest at the bottom and smallest at the top, typical of developing countries. Will continue to grow. • Equal numbers in young and older age groups represent no growth. • Inverted pyramid: more older than younger people, population will shrink. • China is in transition. Visual representations of male and female age structure within a country
The Demographic Transition(use the blank graph Mr. Sierra provided to copy the curves below) • Theory of the demographic transition: as a country moves from a subsistence (survival) economy to industrialization and increased affluence, it undergoes a predictable shift in population growth. Phase 4 Declining population growth because the relatively high level of affluence and economic develop encourage women to delay having children. Phase 3 Stable population growth as the economy and educational system improves and people have fewer children. Phase 2 Rapid population growth because birth rates remain high but death rates decline due to better sanitation, clean drinking water, increased access to food and goods, and access to health care. Phase 1 Slow population growth because high birth rates and high death rates offset each other. Transfer the patterns from the diagram on the left to the blank template (like this one) that Mr. Sierra gave out in class.
Family Planning As the education levels of women increase and they earn incomes of their own, people tend to have fewer children. Many delay having children because of the demands of school and work, resulting in fewer reproductive years. In addition, women with more education and income tend to have more access to information about methods of birth control, they are more likely to interact with their partners as equals, and they may choose to practice family planning with or without the consent of their partners. • Family planning- the regulation of the number or spacing of offspring through the use of birth control.
Environmental Impacts • Population is a critical factor in the impact of humans on Earth. • Resources consumption: energy, water, minerals, etc. for: • Farming/Agriculture • Construction • Manufacturing • Transportation • Generating waste • Deforestation • Habitat Loss • Pollution Affluence - having a lot of wealth such as money, goods, or property. Ecological Footprints Only 1/5 of the human population lives in developed countries, but they (we) consume more than 1/2 of the world’s energy and resources, 2-10 times the environmental impact of people in a developing country!
The IPAT Equation • To estimate the impact of human lifestyles on Earth we can use the IPAT equation: Impact = Population x Affluence x Technology (see page 192 for descriptions of these factors)
Economics The relationship between economic development and population growth rate for developing nations. The Impact of Affluence • Gross domestic product (GDP)- the value of all products and services produced in a year in that country. • A country’s GDP often correlates with its pollution levels.
URBAN growth • Urban populations represent one-half of the human population, but consume three-fourths of Earth’s resources. • More than 75% of people in developed countries live in urban areas. • In developing countries, • 44% of people live in urban areas, but that number is increasing more rapidly than in developed countries and will probably reach 56% by 2030. • Table 7.1 shows that, of the 20 largest cities in the world, 16 are in developing countries. Worldwide, • almost 5 billion people are expected to live in urban areas by 2030.