Human Population Growth & Regulation: Causes, Effects, and Future Implications
Explore human population growth, its impacts and regulation, including the IPAT model, demographic factors, and global trends. Learn about China's One-Child Policy's consequences and Earth's carrying capacity challenges. Understand age structure's effects on population dynamics. Discover how technology, affluence, and social systems influence population growth.

Human Population Growth & Regulation: Causes, Effects, and Future Implications
E N D
Presentation Transcript
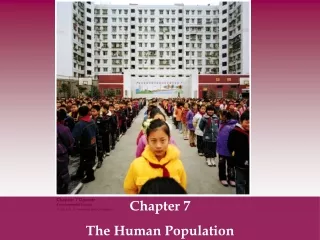
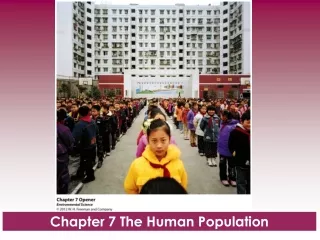
Chapter 6 Human Population
This lecture will help you understand: Human population growth Population, affluence, and technology’s effects Demography Demographic transition Factors affecting population growth
Central Case Study: China’s One-Child Policy In 1970, China’s 790 million people faced starvation The government instituted a one-child policy The growth rate plummeted The policy is now less strict but has unwanted consequences: Killing of female infants Black-market trade in teenaged girls
Our world at seven billion Populations continue to rise in most countries Particularly in poverty-stricken developing nations Although the rate of growth is slowing, we are still increasing in numbers Counting to 1 billion (1/second) would take 31 years—it would take 221 years to count to 7 billion!
The human population is growing rapidly Our population grows by over 80 million each year It took until 1800 to reach 1 billion We added 6 more billion in 130 years We added the most recent billion in 12 years Because of exponential growth (increase by a fixed %), even if the growth rate remains steady, population will continue to grow
Growth rates vary from region to region At today’s 1.2% global growth rate, the population will double in 58 years (70/1.2 = 58) If China’s rate had continued at 2.8%, it would have had 2 billion people within 25 years
Is there a limit to population growth? • Technology, sanitation, medication, and food increase population • Death rates drop, but not birth rates • Earth’s carrying capacity for people? • 2 billion prosperous people • 33 billion very poor people • Thomas Malthus’ An Essay on the Principles of Population (1798) • War, disease, starvation will reduce populations
Different views on population growth • Paul Ehrlich’s The Population Bomb (1968) predicted that population growth would lead to famine and conflict • But intensified food production fed more people • Many economists think depleted resources will be replaced or new resources created • But many resources (e.g., species) cannot be replaced • Quality of life will suffer with unchecked growth • Less space, food, wealth per person • Population growth is a problem if it depletes resources, stresses social systems, and degrades the environment
Several factors affect the environment The IPAT model: I = P A T Our total impact (I) on the environment results from: Population (P): individuals need space and resources Affluence (A): per capita resource use Technology (T): increases use of, or protects, resources Sensitivity (S): a fourth factor showing how sensitive an area is to human pressure Further model refinements include the effects of education, laws, and ethics on the formula
China is an example of the IPAT formula • Elements of the IPAT equation can combine • Causing tremendous impact in a very short time • Modern China’s rapid development is causing unprecedented environmental challenges • Intensive agriculture is eroding farmland • Overuse has dried up the mighty Yellow River • Increasing vehicles are causing urban pollution and massive traffic jams • China shows us what the rest of the world can become
Human population growth and regulation-Effects of human activity Animation: Population Growth Regulation Right-click slide / Select “Play”
Human population growth and regulation-Carrying capacity Animation: Population Growth Regulation Right-click slide / Select “Play”
Demography Demographers study: Population size Density and distribution Age structure Sex ratio Birth, death, immigration, and emigration rates • Demography: applying the principles of population ecology to the study of change in human populations
Population size and density The UN predicts 9 billion humans by 2050 Highest density: temperate, subtropical, tropical biomes Coasts, rivers, cities Lowest density: extreme climates (desert, rainforest, tundra) Also, areas away from water If women have just 0.5 child fewer than the medium scenario, there will be 8, not 9.15, billion by 2050
Population distribution Humans are unevenly distributed around the globe Many unpopulated areas (e.g., deserts, arid grasslands) are environmentally sensitive High S value in the modified IPAT equation Vulnerable to humans (agriculture, ranching, etc.)
Age structure affects population size Age structure: describes relative numbers of individuals in each age class Shown by age structure diagrams (population pyramids) Wide base: has many young that haven’t reproduced yet Population will soon grow rapidly Even age distribution: Remains stable Births = deaths
Age structures: Canada vs. Madagascar Madagascar’s age structure is heavily weighted toward the young (growth rate = 2.9%) Canada’s age structure is balanced (growth rate = 0.4%)
Many populations are aging Although fewer people will be working to support social programs, the elderly can remain productive • The global mean age is now 28—in 2050, it will be 38 • China’s age structure is changing • In 1970, the median age was 20 • By 2050, it will be 45
Sex ratios affect population dynamics Human sex ratios at birth slightly favor males For every 100 females born, 106 males are born Chinese females are selectively aborted 120 boys were reported for 100 girls The undesirable social consequences? Many single Chinese men Teenaged girls are kidnapped and sold as brides
Factors in population change Rates of birth, death, and migration determine whether a population grows, shrinks, or remains stable Birth and immigration add individuals Death and emigration remove individuals Technological advances cause decreased deaths The increased gap between birth and death rates resulted in population expansion Natural rate of population change: change due to birth and death rates alone, excluding migration
QUESTION: Review Which of the following will reduce population growth rates? a) Educating women b) Marriage at an older age c) Providing jobs outside the home d) Increasing the availability of contraceptives e) All of these will help reduce population growth rates
QUESTION: Review Which of the following will reduce population growth rates? a) Educating women b) Marriage at an older age c) Providing jobs outside the home d) Increasing the availability of contraceptives e) All of these will help reduce population growth rates
QUESTION: Review An age structure diagram shaped like an upside down pyramid with a wide top shows a(n) ________ population. a) increasing b) decreasing c) stable d) younger e) more educated
QUESTION: Review An age structure diagram shaped like an upside down pyramid with a wide top shows a(n) ________ population. a) increasing b) decreasing c) stable d) younger e) more educated
QUESTION: Review Describe the relationship between population growth rates and population size. a) Falling rates automatically mean a smaller population b) Falling rates automatically mean a larger population c) Falling growth rates means we no longer have a population problem d) As long as the growth rate is above zero, the population will continue to grow, but more slowly e) People will have to increase rates of growth to replace people that die
QUESTION: Review Describe the relationship between population growth rates and population size. a) Falling rates automatically mean a smaller population b) Falling rates automatically mean a larger population c) Falling growth rates means we no longer have a population problem d) As long as the growth rate is above zero, the population will continue to grow, but more slowly e) People will have to increase rates of growth to replace people that die
Falling growth rates do not mean fewer people Despite falling growth rates, the population continues growing by adding 80 million people each year
Factors affecting total fertility rate Total fertility rate (TFR): the average number of children born to each female during her lifetime Replacement fertility: the TFR that keeps the size of a population stable (about 2.1) Causes of decreasing TFR: Medical care reduces infant mortality Urbanization increases childcare costs Children go to school instead of working Social Security supports the elderly Educated women enter the labor force
Life expectancy is increasing People live longer in countries with good sanitation, health care, and food Urbanization, industrialization, and personal wealth reduces rates of infant mortality Which increases life expectancy (the time a person can expect to live) Demographic transition: a model of economic and cultural change Explains the declining death and birth rates in industrializing nations
The demographic transition As they industrialize, nations move from a stable pre-industrial state of high birth and death rates To a stable post-industrial state of low birth and death rates Industrialization decreases mortality rates So there is less need for large families Parents invest in quality of life, not quantity of kids Death rates fall before birth rates Resulting in temporary population growth
Human population growth and regulation-Death rate Animation: Population Growth Regulation Right-click slide / Select “Play”
The 4 stages of the demographic transition • Pre-industrial stage: low population growth • High death (disease, starvation, few medicines) and birth (compensation for mortality) rates • Transitional stage: industrialization, increased food and medical care reduce mortality rates • High birth rates cause population to surge • Industrial stage: women get jobs and use birth control • Kids do not need to help get food • Post-industrial stage: low birth and death rates stabilize populations
The demographic transition’s four stages Population growth is seen as a temporary phenomenon
Is the demographic transition universal? It has occurred in Europe, the U.S., Canada, Japan, and other nations over the past 200–300 years But it may or may not apply to developing nations The transition could fail: If the population is too large to allow the transition In cultures that place greater value on childbirth or grant women fewer freedoms For people to attain the material standard of living of North Americans, we would need the natural resources of 4.5 more Earths
QUESTION: Weighing the Issues How should the United States address international population growth? Provide funds and education for family planning Provide food and medical care to developing countries Try to help spread democracy and market economics The U.S. should do all of these The U.S. should do none of these—it’s none of our business
QUESTION: Weighing the Issues How should the United States address international population growth? Provide funds and education for family planning Provide food and medical care to developing countries Try to help spread democracy and market economics The U.S. should do all of these The U.S. should do none of these—it’s none of our business
Family planning: key to controlling growth • Family planning: efforts to plan the number and spacing of children • The greatest single factor slowing population growth • Clinics offer advice, information, and contraceptives • Birth control: controlling the number of children born by reducing the frequency of pregnancy • Contraception: deliberate prevention of pregnancy through a variety of methods • Hindered by religious and cultural influences • Rates range from 10% (Africa) to 86% (China)
Empowering women reduces fertility rates Educating women reduces fertility rates, delays childbirth, and gives them a voice in reproductive decisions • A nation’s fertility rates drop when women gain access • To contraceptives, family planning programs, and educational opportunities • Women need control over their reproductive window: • The time in their lives when they can become pregnant
A woman controls her reproductive window Jobs or school delays the birth of a first child Contraceptives space births The window is “closed” after the desired number of kids
Human population growth and regulation-Slowing the growth rate Animation: Population Growth Regulation Right-click slide / Select “Play”
Human population growth and regulation-Decreasing births per woman Animation: Population Growth Regulation Right-click slide / Select “Play”
Policies and family planning work Funding and policies that encourage family planning lower population growth rates in all nations Thailand’s education-based approach to family planning reduced its growth rate from 2.3% to 0.6% Brazil, Mexico, Iran, Cuba, and other developing countries have active programs 1994’s UN population conference in Cairo, Egypt, called for universal access to reproductive health care Offer education, health care, and address social needs Global funding has fallen 33%, slowing progress
Family planning reduces fertility rates Blue: with family planning Red: without family planning
Poverty and population growth are correlated 99% of the next billion people added will be born in poor, less developed regions that are least able to support them Poor societies have higher population growth rates Poverty and population growth make each other worse
Poverty causes environmental degradation Poor people hunt “bush meat”—driving even great apes to extinction • Population growth in poor nations increases environmental degradation • Farming degrades soil in arid areas (Africa, China) • Poor people cut forests, deplete biodiversity, and hunt endangered species
Wealth also impacts the environment Affluent societies have enormous resource consumption With severe, far-reaching environmental impacts Ecological footprints are huge One American has as much environmental impact as 3.5 Chinese or 9 Indians or 13 Afghans
Do Now When you hear the name Martin Luther King, Jr. what comes to mind? What do you think about?
Intelligence PLUS Character The function of education is to teach one to think intensively and to think critically. Intelligence plus character- that is the goal of true education.