Population Dynamics: Factors and Growth Models
350 likes | 379 Vues
Explore the dynamics of population growth, from biotic potential to carrying capacity and factors affecting populations. Learn about exponential and logistic growth models, S-curves, and r-selected vs. K-selected species. Understand life span, survivorship curves, and how factors like natalities and mortalities impact populations. Enhance your knowledge of conservation biology and environmental resistance. Dive into the intricate details of population biology!

Population Dynamics: Factors and Growth Models
E N D
Presentation Transcript
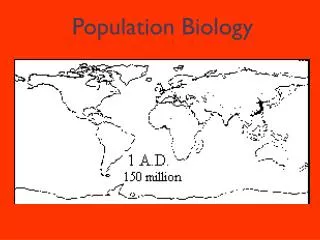
Chapter 6 POPULATION BIOLOGY
OUTLINE • DYNAMICS OF POPULATION GROWTH • FACTORS THAT INCREASE OR DECREASE POPULATIONS • FACTORS THAT REGULATE POPULATION GROWTH • CONSERVATION BIOLOGY
OPTION 1 = $_______________________ OPTION 2 = $_______________________
BIOTIC POTENTIAL • BIOTIC POTENTIAL refers to unrestrained biological reproduction. Biological organisms can produce enormous numbers of offspring if their reproduction is unrestrained. • ENVIRONMENTAL RESISTANCE refers to the total of all factors that limit population growth. These are also known as LIMITING FACTORS • As population increases so does environmental resistance!!
DYNAMICS OF POPULATION GROWTH • POPULATION - all the members of a single species living in a specific area at the same time • EXPONENTIAL GROWTH - growth at a constant rate of increase per unit time; has no limit dN/dt = rN The change in the Number of individuals (dN) per change in time (dt) equals the rate of growth (r) times the number of individuals in the population (N). r is often called the INTRINSIC CAPACITY FOR INCREASE.
EXPONENTIAL GROWTH • Number of individuals added to a population at the beginning of exponential growth is relatively small. But numbers increase quickly because a % increase leads to a much larger increase as the population grows. • J CURVE when the equation is graphed • Exponential growth is a simple, idealized model. In the real world there are limits to growth.
***RULE OF 70 YOU MUST KNOW THIS • RULE OF 70 is used to determine the approximate doubling time of a population Doubling Time = 70 % growth rate 1. If a country was doubling its population every 35 years what would its growth rate be? 2. Currently, human pop growth rate is 1.2% In what year do you predict the world population will have doubled?
CARRYING CAPACITY • CARRYING CAPACITY - limit of sustainability that an environment has in relation to the size of a species population • OVERSHOOT - population exceeds the carrying capacity of the environment and death rates rise as resources become scarce • POPULATION CRASH - growth becomes negative and the population decreases suddenly • BOOM AND BUST - population undergoes repeated cycles of overshooting followed by crashing
GROWTH TO A STABLE POPULATION • LOGISTIC GROWTH - growth rates regulated by internal and external factors until coming into equilibrium with environmental resources • dN/dt = r N (1 - N/K) • Terms have the same definitions as previous slide, with K added to indicate carrying capacity. • Growth rate slows as population approaches carrying capacity. • S CURVE when the equation is graphed
r AND K SELECTED SPECIES • r SELECTED SPECIES rely upon a high reproductive rate to overcome the high mortality of offspring with little/no parental care. ie: A clam releases a million eggs in a lifetime but the larva are so small that few survive. • K SELECTED SPECIES have few offspring but more parental care so most young survive. ie: An elephant reproduces every 4 or 5 years.
REPRODUCTIVE STRATEGIES r-selected species 1. 2. 3. 4. 5. 6. 7. 8. 9. 10. K-selected species 1. 2. 3. 4. 5. 6. 7. 8. 9. 10.
FACTORS AFFECTING POPULATION GROWTH • EXTERNAL FACTORS include habitat quality, food availability and interaction with other organisms. • INTERNAL FACTORS include physiological stress due to overcrowding, maturity, body size, and hormonal status. • These factors are DENSITY DEPENDENT, meaning as population size increases the effect intensifies. • DENSITY INDEPENDENT effects (drought, an early frost, flooding, landslides, etc.) also may decrease population size.
FACTORS THAT INCREASE POPULATION • NATALITY – birth rate • FECUNDITY - physical ability to reproduce • FERTILITY - measure of actual number of offspring produced • IMMIGRATION - organisms introduced into new ecosystems • Dispersal of organisms by wind or water currents over long distances. Sometimes carried by animals or on rafts of drifting vegetation.
FACTORS THAT DECREASE POPULATION • EMIGRATION – individuals leaving an area • MORTALITY - death rate • SURVIVORSHIP - percentage of cohort surviving to a certain age • LIFE EXPECTANCY - probable number of years of survival for an individual of a given age • Increases as humans age. By older age, most individuals destined to die early have already done so. • Has risen in nations/areas with good nutrition, sanitation and medical care • Women live longer than men.
LIFE SPAN • LIFE SPAN - longest period of life reached by a given type of organism • Bristlecone pine lives 4,600 years. • Human maximum lifespan is 120 years. • Microbes may live a few hours. • Differences in relative longevity among species are shown as survivorship curves.
SURVIVORSHIP CURVES • FOUR GENERAL PATTERNS: (NOTE THE #’s) I. Full physiological life span if organism survives childhood • Example: top consumers, Humans II. Probability of death unrelated to age • Example: Sea gull, rodents IV. Mortality peaks both early and late in life. • Example: Deer, crabs III. Mortality peaks early in life. • Example: oysters, sea turtles, oak tree
FACTORS THAT REGULATE POP. GROWTH ENVIRONMENTAL RESISTANCE • DENSITY DEPENDENT FACTORS • Have more influence as the population density increases • They slow population growth • Impact large % of population • Disease, competition, predation, stress and stress related issues – aggression, decreased fertility and immunity, pathological behaviors due to high density
FACTORS THAT REGULATE POP. GROWTH ENVIRONMENTAL RESISTANCE • DENSITY INDEPENDENT FACTORS • Not influenced by the size of the population • All organisms are affected equally regardless of population density • Fire, floods, weather, natural disasters, human-caused habitat disruption, etc.
FACTORS THAT REGULATE POP. GROWTH ENVIRONMENTAL RESISTANCE • INTRINSIC FACTORS - operate within or between individual organisms in the same species • competition, territoriality, stress, etc • EXTRINSIC FACTORS - imposed from outside the population • predation, climate, natural disasters, etc.
FACTORS THAT REGULATE POP. GROWTH ENVIRONMENTAL RESISTANCE • ABIOTIC FACTORS - Caused by non-living environmental components. Tend to be density independent, and do not really regulate population although they may be important in increasing or decreasing numbers. ie: climate, weather, natural disasters, fire • BIOTIC FACTORS - Caused by living organisms. Tend to be density dependent. They regulate population size by decreasing natality or increasing mortality.
DENSITY DEPENDENT FACTORS(biotic factors) • INTERSPECIFIC INTERACTIONS (between different species) • predator/prey, mutualism, commensalism, etc • Resource partitioning, invasives, etc Predator-Prey Oscillating Cycles
DENSITY DEPENDENT FACTORS (biotic factors) • INTRASPECIFIC INTERACTIONS - competition for resources by individuals within a population • As population density approaches the carrying capacity, resources become limited. • Control of access to resources by territoriality; owners of territory defend it and its resources against rivals. • STRESS-RELATED DISEASES occur in some species when conditions become overcrowded. • DISEASES – tend to spread faster with a higher population density
CONSERVATION BIOLOGY • Critical question in conservation biology is the minimum population size of a species required for long term viability. • SPECIAL CASE OF ISLANDS • ISLAND BIOGEOGRAPHY • MacArthur and Wilson proposed that species diversity is a balance between colonization and extinction rates. • Small islands vs Large islands • Far from mainland vs closer to mainland
CONSERVATION GENETICS • In a large population, genetic diversity tends to be preserved. A loss/gain of a few individuals has little effect on the total gene pool. • However, in small populations small events can have large effects on the gene pool. • GENETIC DRIFT • Change in gene frequency due to a random event • FOUNDER EFFECT • Few individuals start a new population.
CONSERVATION GENETICS • DEMOGRAPHIC BOTTLENECK - just a few members of a species survive a catastrophic event such as a natural disaster • Founder effects and demographic bottlenecks reduce genetic diversity. There also may be INBREEDING due to small population size. Inbreeding may lead to the expression of recessive genes that have a harmful effect on the population.
POPULATION VIABILITY ANALYSIS • MINIMUM VIABLE POPULATION is the minimum population size required for long-term survival of a species. ie: • The number of grizzly bears in North America dropped from 100,000 in 1800 to 1,200 now. The animal’s range is just 1% of what is once was and the population is fragmented into 6 separate groups. Biologists need to know how small the bear groups can be and still be viable in order to save the grizzly.
METAPOPULATIONS • METAPOPULATION - a collection of populations that have regular or intermittent gene flow between geographically separate units • SOURCE HABITAT - Birth rates are higher than death rates. Surplus individuals can migrate to new locations. • SINK HABITAT - Birth rates are less than death rates and the species would disappear if not replenished from a source.