Download
1 / 31
310 likes | 432 Vues
This overview explores the fundamental characteristics of populations in biology, focusing on geographic distribution, density, and growth rates. It examines how populations can experience negative or positive growth and the factors influencing this growth, such as birth and death rates, immigration, and emigration. Throughout, the concepts of carrying capacity and limiting factors are discussed, highlighting their significance in population regulation. Understanding these dynamics is crucial for studying population ecology and managing wildlife and human populations sustainably.

E N D
Characteristics of Populations • Geographic Distribution- area inhabited by a population • Density- number of individuals per unit area Ex. 150 bullfrogs per 3 km2 • What is the population density? • Growth rate- populations may experience negative or positive growth
Population Growth • Population Growth – an increase in the size of a population over time • Factors that affect population growth • # of Births • # of Deaths • # of individuals that enter or leave • Immigration vs. Emigration *Immigration- individuals move IN *Emigration- individuals move OUT orEXIT
PopulationGrowth Can be negative or positive… • Suppose a penguin population was 1200 at the beginning of the year and 1600 at the end of the year… What was the total growth? • What if 450 adult penguins died during the year; what would the population’s growth be?
Is not linear… Dollars earned Time in hours Population Growth
Population size Time Population Growth • It is exponential- as a population gets larger, it also grows faster. • Individuals in a population reproducing @ a constant rate in “ideal” conditions… See pg. 121 Figure 5-3
Population Growth • Cannot grow exponentially for very long • Has limits • Limiting factors- cause a population to stop increasing • Density dependent factors – depend on population size • have an increasing effect as the population increases
Density Dependent Factors • Disease • Competition for resources-food, water, mates, territories, nesting sites • Predation • Stress
60 2400 50 2000 40 1600 1200 30 20 800 10 400 0 1955 1960 1965 1970 1975 1980 1985 1990 1995 Moose Wolves How do increases and decreases in the moose population affect the wolf population?
Density independent factors –affect all populations regardless of density • Temperature/Climate • Storms • Floods • Droughts
Carrying Capacity The effects of Limiting Factors results in… carrying capacity- the number of individuals in the population that an environment can support
Carrying capacity Number of Yeast Cells Time (hours) Growth Curve
1. Beginning Growth • Few starting members have offspring • The population increases slowly
Carrying capacity Number of Yeast Cells Time (hours) Growth Curve Beginning Growth
2. Rapid Growth • Many organisms each reproducing • Fast increase • Exponential growth
Carrying capacity Number of Yeast Cells Time (hours) Growth Curve Rapid Growth
3. Leveling Off • Becomes more difficult for each organism to meet its needs • Effect of density dependent factors increases • Growth slows
Carrying capacity Number of Yeast Cells Time (hours) Growth Curve Leveling Off
4. Fluctuations • The number of organisms tends to remain near a level the environment can support • If the number of organisms goes too high: organisms die and the population drops • If the population is slightly low: births increase and the population rises
Carrying capacity Number of Yeast Cells Time (hours) Growth Curve Fluctuations
Carrying capacity Number of Yeast Cells Time (hours) 5. Carrying Capacity • The maximum number of organisms an environment can support
TWO main Growth Curve Patterns 1. J-shape- organisms in unstable environments • Small body size • Reproduce rapidly • Short life span • Numbers die off under unfavorable conditions-few survivors reproduce rapidly when conditions improve • For example: bacteria, insects
Growth Curve Patterns 2. S-shape- organisms in stable environments • Larger body size • Reproduce slower • Longer life span • Mature slower, live longer • For example: elephants, trees, humans
Carrying capacity Number of Yeast Cells Time (hours) S-shape Growth Curve Pattern
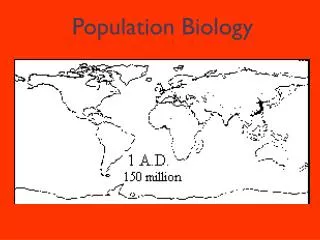
Human Population Growth Industrial Revolution begins Agriculture begins Bubonic plague Plowing and irrigation
Human Population Growth • Birth Rate: the number of babies that were born in the past year • Death Rate: the number of people who have died in the past year. http://www.ux1.eiu.edu/~cfruf/popfac.htm
Human Population Growth • Fertility Rate: The number of babies each woman is having during her fertile years. Total Fertility rates in the U.S. from 1917 to2000. http://www.ux1.eiu.edu/~cfruf/els_fertility_rates.htm
Human Population Growth • Age Structure: can be used to determine how quickly a country or area is growing.
U.S. Population Rwandan Population Males Females Males Females Age Distribution
In which country…. • Are most individuals reproductive? • Are most individuals pre-reproductive? • Would the population be growing the fastest? • Would the population be growing the slowest? • Populations that are not growing have about the same numbers of each age group.