Human Population Biology
230 likes | 531 Vues
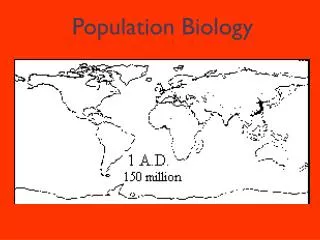
Human Population Biology. Mark Mayo Cypress College. Last Update: 4/29/14. Human Population Growth . We have been busy! 1997 - 5,800,000,000 2001 (1/21/01) - 6,123,546,443 2013 (11/12/13) - * 7,229,827,703 increases 1.5% annually. Human Population Growth.

Human Population Biology
E N D
Presentation Transcript
Human Population Biology Mark Mayo Cypress College Last Update: 4/29/14
Human Population Growth • We have been busy! • 1997 - 5,800,000,000 • 2001 (1/21/01) - 6,123,546,443 • 2013 (11/12/13) - *7,229,827,703 • increases 1.5% annually
Human Population Growth • We have been busy! • 1/3 of world population is malnourished • most humans live on 10% of land • ½ live within 300 miles of seas and ocean
Human Population Growth • The link below shows a great video of the earth at night through on of our satellites. • http://www.guardian.co.uk/science/video/2012/dec/06/nasa-satellite-earth-electric-light-video
Human Population Growth • Why are we so successful at increasing human population to the point of being out of control? • human intellect led us to tame new environments, areas, climates with relative ease • we increased the carrying capacity of the areas in which we live
Human Population Growth • we defeated most limiting factors: • grew better food (more food, better food, more food/unit area * • improved healthcare or brought at least some to areas • improved pre and post natal care to reduce infant mortality • provide and improved geriatric health care • sanitation was improved • tamed disease and disease vectors such as insects and rodents • created vaccines to prevent serious illness and plagues • used fossil fuels and hydroelectric plants were used to power our population growth • mass production and industrial methods created more goods faster to help the population • education helped too!
Human Population Growth • What Else is Still Out There for Us? • Plagues– epidemics and pandemics • cholera • anthrax • bubonic • Influenza (bird flu?) • AIDS HIV
Human Population Growth • What Else is Still Out There for Us? • Vaccines are less able to cope • streptococcus • staphylococcus • STDs (gonorrhea, herpes, clamydia, syphilis) • E. coli
Human Population Growth • What Else is Still Out There for Us? • Increased use of antibiotics has reduced their effect • we have used artificial selection to enrich bacteria with resistance to antibiotics • we demand antibioticsfor viral infections
Human Population Control • Projections • based on 2014 figures – 1.55% increase • world population could reach 9 billion by 2042 • world population could reach 8 billion by 2024 • natural resources will not support this population • we actually cannot support the present population of 7 billion * • Good news = population growth is slowing
Human Population Control • Fertility rates – average # of children/woman during her reproductive years • replacement rate – the reproductive rate to just barely maintain a level population • in developed countries = 2.1 • in less developed countries = 2.5 • in 1950 the total fertility rate was 6.5 (baby boom) * • in 1996 the total fertility rate was 3.0 (still too high)
Human Population Control • Fertility rates vary by region/country • lowest = 1-1.5% Eastern Europe, Europe, China
Human Population Control • Fertility rates vary by region/country • medium low = 2-2.6% North+South America,East Asia/Pacific, India, Middle East, No. Africa
Human Population Control • Fertility rates vary by region/country • medium high = 2.3-4% OPEC countries, South Asia,Central America, Sub-Saharan Africa
Human Population Control • Fertility rates vary by region/country • highest – >4% - Niger (7%), Mali (6.25%),Somalia, Uganda, Afghanistan
Human Population Control • 1/3 of current population is pre-reproduction • A very rapid growth spurt will result if nothing is done to reduce the need and desire to procreate
Resource Allocation * • US has 4.46% of the world population *–322,150,349 people (4/29/14) • produces 21% of all goods and services • uses 25% of minerals • uses 25% of fossil fuels • makes 25% of all trash
Resource Allocation * • India has 17.5% of world population *1,264,794,950 (4/29/14) • produces 1% of all goods and services • uses 3% of the minerals • uses 3% of fossil fuels • produces 3% of all trash
Negative Implications of Reduced Growth + Baby Boomers • Older individuals expect to be cared for • food • medical care • housing • Energy • Older individualsusually produce little
Negative Implications of Reduced Growth + Baby Boomers • What about the baby boom? • as the population grays there are more non-productive members • the smaller younger population will support the larger aged population • The financial burden grows daily • Are you willing to explain why your parentsand grandparents must go back to work? • It is planned to INCREASE the age YOU can retire to 70 or higher