Population Biology
Population Biology. Definition. A population is a group of organisms of the same species, interbreeding or closely related through interbreeding and evolving as a unit. Review. Community: a group of interacting plants and animals forming an identifiable group. Review.

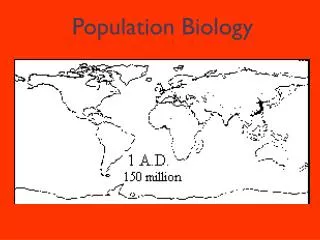
Population Biology
E N D
Presentation Transcript
Definition • A population is a group of organisms of the same species, interbreeding or closely related through interbreeding and evolving as a unit.
Review • Community: a group of interacting plants and animals forming an identifiable group
Review • Biosphere: the entire part of the earth where organisms are found
Review • Habitat: the place where an organism naturally lives or grows
Review • Niche: position or function of an organism in its community – its occupation
Population Size Calculations • Simplest calculations involve changes in populations over a time period in a defined space. • gr= N/ t
Ex) What is the growth rate? Initial Population 200 20 gulls move in (immigration) 20 0 gulls move out (emigration) 0 32 chicks hatch (natality) 32 10 chicks die -10 2 adults die -2 Time 1 year Total 240 Annual Increase of +40 birds per year
Density • Formula: D = N/A or N/V • Density equals number of organisms divided by area (or volume or space) • Eg. 200 bison in a 100 acre pasture is a density of 2 bison per acre
Rate of Change • Often uses density • R = D / t • Rate of density change equals change in density over change in time.
Example In 1996 there were 10 Grizzly Bears in a 10 000 ha forest. In 2005 there are only 8. What is the rate of density change? R = D / t R = 0.0008 – 0.001 / 2005 – 1996 R= - 0.0000222 bears/ha/y
Per Capita Growth Rate • Or cgr • The amount that a population changes per individual over a set period of time • Cgr = N / N • Per capita growth rate = change in number divided by initial population size
CGR A lynx population was 19 per 10 000 sq. km in 1991. In 1993 it was 3 per 10 000 sq. km. What was the cgr of this population from 1991 to 1993? Cgr = N/ N = -16 / 19 = - 0.84 per lynx
Distributions of Populations • Can be clumped – more individuals together than apart • Often involves cooperation among group members (eg. Herd, pack)
Distribution of Populations • Can be random – not seen often in nature • Organisms have no effect on each other
Distribution of Populations • Can be uniform: evenly distributed • Usually due to competition between individuals • Territories, etc.
Open Populations • Are those where organism can enter or leave • Often have S-shaped curves
Closed Populations • True closed populations are rare • On islands, isolated communities
Population Growth Graphs • typically have numbers on vertical axis and time on horizontal axis
Logistic Growth S shaped curves are typical of stable populations.
Exponential Growth • J shaped curve (initially) occurs with short-lived populations that rapidly deplete their environment
Overshoots • Result when k is greatly exceeded and the environment deteriorates
Carrying Capacity • Is the number of organisms a habitat can sustain over the long term • “k” • Influenced by Biotic Potential and Environmental Resistance
Biotic Potential • maximum number of offspring produced • capacity of offspring to survive to reproduce • number of times per year an organism reproduces • age at which offspring are reproductively mature
Generally speaking, smaller, simpler organisms have a higher biotic potential than larger organisms.
Environmental Resistance • limiting factors on a population • Availability of resources (food, water, space, etc.) • Competition for resources with other organisms Intra-specific – within a species Inter-specific – between a species • Predators • Disease • Climate change
Environmental Resistance • Puts brakes on biotic potential (B) – maximum reproductive rate
Environmental Resistance Environmental Resistance B K
Limiting Factors on Populations • Law of the Minimum: if any one of many needed nutrients/limiting factors is reduced below the required levels, the population growth rate declines
Limiting Factors • Can be density independent – those that will affect a population regardless of its size • Eg. Cold winter
Limiting Factors • Can be density dependant – those that increase when the population size increases • Eg. Disease • Predation • Food Supply
Gause’s Law • Competitive exclusion • No two species can remain in competition for a limited resource
Other Graphs • Survivorship curves
Other Graphs • Age distribution pyramids
Population Histograms • are graphs showing the composition by age and gender of a population at a specific time. Population histograms have the following characteristic shapes:
R and K Population Strategies • This is a continuum • Most populations fall between these two extremes
K Selection • k-selected species is one that typically has: • Stable environmental conditions • Slow growing individuals • Low reproduction rate (B) • Parental care of offspring
R- Selection • An R-selected species is one that typically has: • Unpredictable environment • Small individuals with short life spans • Reproduce at a high rate • Little or no parental care
Life History Patterns • Some organisms undergo regular patterns of growth and decline known as population cycles • Small rodents, rabbits, lemmings often cycle every 1 – 4 years
Population Cycles • Can be due to fluctuations in food supply, predation, or both
Chaos Theory • Used by population biologists to study the general trends in populations • Small uncertainties in short-term prediction of individual events may be magnified to such an extent that complex systems become quite unpredictable
Chaos • The ‘butterfly effect” • This is the sensitivity of a system to the initial conditions • Change any starting parameter slightly and the resulting changes magnify until the result is very different from the initial prediction
Technologies • Include: • Radio collars
Technologies • Sampling methods • Quadrats – counting organisms in defined areas