Human Population Trends and Demographic Transition
290 likes | 320 Vues
Explore how the human population size has evolved in the past 200 years, examine age structures' role in population trends, and learn about the demographic transition stages. Understand the impact of migration, fertility rates, and life expectancy on population growth, and study different survivorship types. Gain insights into developed and developing countries' population characteristics and strategies to manage population growth. Discover how education and women's roles influence fertility rates and societal prosperity.

Human Population Trends and Demographic Transition
E N D
Presentation Transcript
Objectives • Describe how the size and growth rate of the human population has changed in the last 200 years. • Define four properties that scientists use to predict population sizes. • Makepredictions about population trends based on age structure. • Explain why different countries may be at different stages of the demographic transition.
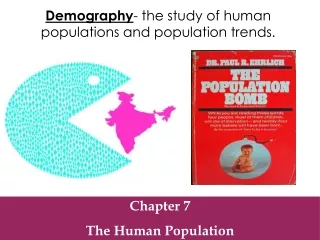
Studying Human Populations • Demographyis the study of the characteristics of populations, especially human populations.
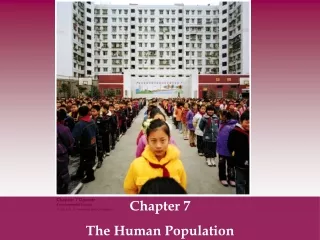
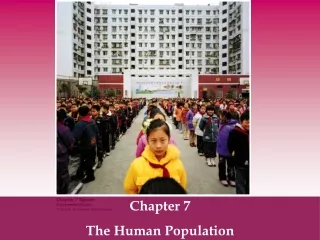
Studying Human Populations • Countries with similar population trends are often grouped into two general categories: developed and developing countries. • Developed countries • higher average incomes, slower population growth, diverse industrial economies, & stronger social support systems • Developing countries • lower average incomes, simple & agriculture-based economics, & rapid population growth
The Human Population Over Time • Exponential growth in the 1800s (population growth rates increased during each decade) • Mostly due to decreased death rates • increases in food production • clean water • improvements in hygiene • safe sewage disposal • discovery of vaccines
Age Structure • Classification of members of a population into groups by age or distribution of members of a population in terms of age groups • Helps make predictions • Countries with high rates of growth usually have more young people. Countries that have slow or no growth usually have an even distribution of ages in the population. • Graphed in a population pyramid
% of newborns in a population that can be expected to survive to a given age Used to predict population trends To predict survivorship, demographers study a group of people born at the same time & notes when each member of the group dies. Survivorship
Survivorship • Type I=most people live to be very old • Wealthy developed countries like Japan & Germany • Type II=populations have a similar death rate at all ages • Type III=many children die • Very poor, underdeveloped countries • Type I & Type III may result in populations that remain the same size or grow slowly.
Fertility Rate • The number of births (usually per year) per 1,000 women of childbearing age (usually 15 to 44) • Replacement level is the average number of children each parent must have in order to “replace” themselves. This number is slightly more than 2 because not all children born will survive & reproduce.
Migration • Any movement of individuals or populations from one location to another • Movement INTO an area=Immigration • Movement OUT of an area=Emigration (Exit)
Life Expectancy • Average length of time that an individual is expected to live • Most affected by infant mortality • Expensive medical care is not needed to prevent infant deaths. Infant health is more affected by the parents’ access to education, food, fuel, and clean water.
The Demographic Transition • The general pattern of demographic change from high birth & death rates to low birth & death rates, & observed in the history of more-developed countries • Industrial development causes economic & social progress that then affects population growth rates
First Stage A society is in a preindustrial condition The birth & death rates are both at high levels Population size is stable Second Stage A population explosion occurs Death rates decline as hygiene, nutrition, & education improve. Birth rates remain high Stages of the Transition
Third Stage Population growth slows because birth rate decreases Population size stabilizes, but the population is much larger than before the demographic transition Fourth Stage Birth rate drops below replacement level Population begins to decrease It has taken from 1-3 generations for the demographic transition to occur. Stages of the Transition
Women and Fertility • The factors most clearly related to a decline in birth rates are increasing education & economic independence for women. • In the demographic transition model, the lower death rate of the second stage is usually the result of increased levels of education. • Educated women find that they don’t need to bear as many children to ensure that some will survive. They may also learn family planning techniques. • Women are able to contribute to their family’s increasing prosperity while spending less energy bearing & caring for children. • As countries modernize, parents are more likely to work away from home. If parents must pay for child care, children may become a financial burden rather than an asset.
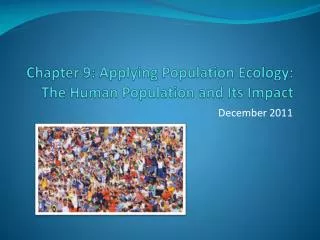
Objectives • Describe three problems caused by rapid human population growth. • Compare population growth problems in more-developed countries and less developed countries. • Analyzestrategies countries may use to reduce their population growth. • Describe worldwide population projections into the next century.
Changing Population Trends • Throughout history, populations that have high rates of growth create environmental problems. • A rapidly growing population uses resources at an increased rate & can overwhelm the infrastructure of a community. • Infrastructure is the basic facilities of a country or region, such as roads, bridges, sewers, power plants, subways, schools, & hospitals.
Problems of Rapid Growth • Uses resources faster than the environment can renew them • Standards of living decline when wood is removed from local forests faster that it can grow back, or when wastes overwhelm local water sources. • Symptoms of overwhelming populations include suburban sprawl, polluted rivers, barren land, inadequate housing, & overcrowded schools.
Unsafe Water • In places that lack infrastructure, the local water supply may be used not only for drinking & washing but for sewage disposal. • The water supply then becomes a breeding ground for organisms that can cause diseases. • Many cities have populations that are doubling every 15 years, & water systems can’t be expanded fast enough to keep up with this growth.
Impacts on Land • Arable land is farmland that can be used to grow crops. • Growing populations make trade-offs between competing uses for land such as agriculture, housing, or natural habitats. • For example, Egypt has a population of more than 69 million that depends on farming within the narrow Nile River valley. • Most of the country is desert, and less than 4 percent of Egypt’s land is arable. • The Nile River Valley is also where the jobs are located, and where most Egyptians live. They build housing on what was once farmland, which reduces Egypt’s available arable land. • Urbanizationis an increase in the ratio or density of people living in urban areas rather than in rural areas. • People often find work in the cities but move into suburban areas around the cities. • This leads to traffic jams, inadequate infrastructure, & reduction of land for farms, ranches, & wildlife habitat. Meanwhile, housing within cities becomes more costly, more dense, & in shorter supply.
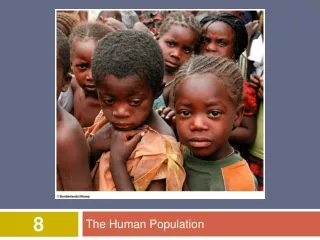
A Demographically Diverse World • Not every country in the world is progressing through each stage of demographic transition. • In recent years, the international community has begun to focus on the least developed countries. • Least developed countries are countries that have been identified by the United Nations as showing the fewest signs of development in terms of income, human resources, & economic diversity. • These countries may be given priority for foreign aid & development programs to address their population & environmental problems.
A Demographically Diverse World • Populations are still growing rapidly in less developed countries, with most of the world’s population now within Asia.
ManagingDevelopment & Population Growth • Today, less developed countries face the likelihood that continued population growth will prevent them from imitating the development of the world’s economic leaders. • Countries such as China, Thailand, & India have created campaigns to reduce the fertility rates of their citizens. • These campaigns include public advertising, family planning programs, economic incentives, or legal punishment. • In 1994, the United Nations held the International Conference on Population & Development (ICPD), • It involved debates about the relationships between population, development, & the environment. • Many countries favor stabilizing population growth through investments in development, especially through improvements in women’s status.
Managing Development and Population • With these goals, worldwide fertility rates are dropping as shown below.
Growth Is Slowing • Fertility rates have declined in both more-developed & less-developed regions. • Demographers predict that this trend will continue & that worldwide population growth will be slower this century than the last century. • If current trends continue, most countries will have replacement level fertility rates by 2050. If so, world population growth would eventually stop.
Projections to 2050 • Looking at the graph below, most demographers predict the medium growth rate, and a world population of 9 billion in 2050.