Chapter 7 The Human Population
380 likes | 470 Vues
Chapter 7 The Human Population. Why has population grown more rapidly in the last 400 years?.

Chapter 7 The Human Population
E N D
Presentation Transcript
Chapter 7 The Human Population
Why has population grown more rapidly in the last 400 years? • Better living conditions such as increased agricultural output, sanitation improvements, advances in medicine and technology all contributed to a decline in death rates but birth rates remained relatively high. • See Figure 7.1 for J shaped curve showing exponential growth.
Human Population Growth Chart • Figure 7.1 shows the global human population has grown more rapidly in the last 400 years than at any other time in history.
ThomasMalthus • Thomas was one of the first proponents of the notion that the human population could exceed Earth’s carrying capacity. • Human population was growing exponentially while food supply was more linear. • Malthus believed that a limited food supply would lead to conflict and wars.
Scientists Disagree on Earth’s Carrying Capacity • Figures 7.2 show theoretical models of food supply and population size. • (a) shows food deficit • (b) shows improvements in agricultural technology (inorganic fertilizers, genetically modified crops)
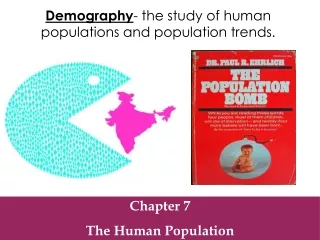
Factors that Drive Human Population Growth • Demography- the study of human populations and population trends. • Changes in Population Size • Fertility • Life Expectancy • Infant and Child Mortality • Aging and Disease • Age Structure • Migration
Changes in Population SizeImportant Terms • Immigration- the movement of people into a country. • Emigration- the movement of people out of a country. • Crude birth rate (CBR)= the number of births per 1,000 individuals per year. • Crude death rate (CDR)= the number of deaths per 1,000 individuals per year.
Changes in Population Size • Figure 7.3 shows the human population as a system. We can think of births and immigration as inputs and deaths and emigration as outputs.
Changes in Population SizeImportant Formulas To calculate the global population growth rate: [ CBR – CDR ] 10 To calculate the national population growth rate: [(CBR + immigration) – (CDR + emigration)] 10 Note: Since CBR and CDR are expressed per 1,000 people, we divide by 10 to express the value as a percentage.
Changes in Population SizeImportant Formulas Once the growth rate of a population is calculated and assuming the growth rate is constant, we can calculate the number of years it takes for a population to double. The doubling time can be approximated mathematically using a formula called the rule of 70: Doubling time (in yrs) = 70 Growth rate
Projected World Population Growth • Figure 7.4 Demographers project that the global human population will be somewhere between 8.1 billion and 9.6 billion by 2050.
Fertility • Total fertility rate (TFR) - an estimate of the average number of children each woman in a population will bear. • Replacement level fertility (RLF) - the total fertility rate required to offset the average number of deaths in a population and so that the current population size remains stable. • RLF also depends on rates of pre-reproductive mortality, which depend on a country’s economic status.
Fertility • Developed countries- countries with relatively high levels of industrialization and income. • Developing countries- countries with relatively low levels of industrialization and income of less that $3 per person per day. • When TFR is equal to replacement-level fertility and immigration and emigration are equal, a country’s population is stable.
Life Expectancy Life expectancy- the average number of years that an infant born in a particular year in a particular country can be expected to live, given the current average life span and death rate of that country. • Figure 7.5 shows average life expectancies around the world.
Life Expectancy • Life expectancy is generally higher in countries with better health care. • A higher life expectancy also tends to be a good predictor of high resource consumption rates and environmental impacts. • In 2008, global life expectancy was 69 years; 67 for males, 70 for women. • In 2008, US life expectancy was 78 years; 75 for males, 81 for women.
Life Expectancy • Infant mortality rate - the number of deaths of children under 1 year of age per 1,000 live births. • Child mortality rate - the number of deaths of children under age 5 per 1,000 live births. • Figure 7.6 shows the infant mortality around the world. Infant mortality rates are lower in developed countries and higher in developing countries.
Infant and Child Mortality • If a country’s life expectancy is relatively high and its infant mortality rate is relatively low, we might predict good health care and adequate food supply/drinking water. • In 2009, global infant mortality rate was 46. The infant mortality rate in the US was 6.6 and 3.6 in countries like France. • Variation in infant mortality rates within a country is probably related to socioeconomic status and varying access to adequate nutrition and health care (environmental justice).
Aging and Disease • Disease is an important regulator of human population. • In the past, tuberculosis and malaria were the two biggest killers worldwide. However, HIV (which causes AIDS) is presently responsible for more deaths annually. • HIV has a significant effect on infant mortality, child mortality, population growth, and life expectancy.
Aging and Disease • In 2009, 33 million people were living with HIV. • Of the 33 million infected, 22 million are in Sub-Saharan Africa. • Figure 7.7 shows the number of people affected by HIV worldwide.
Age Structure • Age structure diagrams (population pyramids)- visual representations of age structure within a country for males and females. • As shown in Figure 7.8 on next slide, (a) India – rapid growing population (b) US – population stability (c) Germany – population decline (d) China – one child policy will eventually lead to a decline.
Age Structure (key points) • Population momentum – continued population growth that does not slow in response to growth reduction measures. • A wide based pyramid indicates that population will grow because a large number of women (0-15) have not yet reached child bearing years. • An age structure diagram that looks more like a column from age 0 to age 50 is experiencing slow growth or approaching no growth. • A country with a greater number of older people than younger people will have an age structure diagram that resembles an inverted pyramid and will have a declining population.
Migration • A country with a relatively low CBR but a high immigration rate may still experience population growth. • Net migration rate is the difference between immigration and emigration in a given year per 1,000 people in a country. • Positive net migration means more immigration than emigration.
The Theory of Demographic Transition • Demographic transition is the theory that as a country moves from a subsistence economy to industrialization and increased affluence, it undergoes a predictable shift in population growth. There are four phases of demographic transition.
The Stages of the Demographic Transition • Phase 1: Slow population growth because there are high birth rates and high death rates which offset each other. • Phase 2: Rapid population growth because birth rates remain high but death rates decline due to better sanitation, clean drinking water, increased access to food and goods, and access to health care. • Phase 3: Stable population growth as the economy and educational system improves and people have fewer children. • Phase 4: Declining population growth because the relatively high level of affluence and economic develop encourage women to delay having children.
Family Planning • Family planning- the regulation of the number or spacing of offspring through the use of birth control. • Figure 7.12 shows total fertility rate for educated and uneducated women in six countries. Fertility is strongly related to female education in many developing countries.
The 12 Most Populous Countries in the World • Figure 7.13 shows that only 3 of the 12 most populated countries are considered developed nations. • The population disparity between rich and poor countries has accelerated in recent decades.
Economic Development • Of Earth’s 6.8 billion people, 5.6 billion live in developing counties, 1.3 billion live in developed countries. • Affluence is the state of having plentiful wealth; the possession of money, goods, and property.
Economic Development • The relationship between economic development and population growth rate for developing nations. • Figure 7.14 shows population growth past (solid line) and future (dotted line).
Ecological Footprints • The world average ecological footprint is 2.7 ha (6.7 acres) per capita. • U.S. has the largest ecological footprint at 9.0. • Figure 7.15 Per capita ecological footprints. Many countries exceed the global average footprint of 2.7 ha per capita.
The IPAT Equation • To estimate the impact of human lifestyles on Earth we can use the IPAT equation: Impact= Population X Affluence X Technology • Figure 7.16 shows a comparison of material possessions between a Thai family and a Japanese family.
Local, Global, and Urban Impacts • Impacts on the environment may occur locally (within the city or country) or they may be global. • In general, highly localized impacts are typical of rural, agriculturally based societies. • Global impacts are typical of affluent or urban societies that tend to be more focused on industrial production and high technology.
Urban Impacts • Figure 7.18 More than one-half of the world’s population will live in urban settings by 2030. • An urban area, as defined by the US Census Bureau, is one that contains more than 386 people per square km (1,000 per square mile).
Urban Impacts • Table 7.1 shows 16 of the 20 largest cities in the world are from developing countries. • Worldwide estimates expect almost 5 billion people living in urban areas by 2030.
The Impact of Affluence • Gross domestic product (GDP)- the value of all products and services produced in a year in that country. • GDP is made up of consumer spending, investments, government spending, and exports minus imports. • A countries GDP often correlates with its pollution levels.
Sustainable Development • In 2005, a Millennium Ecosystem Assessment project was created and several conclusions were drew. • Ecosystem sustainability will be threatened if the human population continues to grow and consume resources at its present rate. • If we establish sustainable practices, we may be able to improve the standard of living for a large number of people.