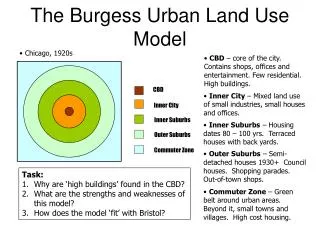
Cities and Suburbs
Cities and Suburbs. Regionalism, Inequities, and Solutions. Material taken from:. The “Power of Place”. Comparing three Congressional districts poor central city working class, struggling city & suburban district wealthy outer-ring suburban. New York’s 16th Congressional District.

Cities and Suburbs
E N D
Presentation Transcript
Cities and Suburbs Regionalism, Inequities, and Solutions
The “Power of Place” • Comparing three Congressional districts • poor central city • working class, struggling city & suburban district • wealthy outer-ring suburban
New York’s 16th Congressional District • Poorest and one of most Democratic Congressional districts in the nation • Until 1960 was haven for Italian, Irish, & Jewish working- & middle-class families • Between 1969 and 1996 manufacturing jobs fell from 51,800 to 14,100
New York’s 16th Congressional District • Influx of poor Puerto Ricans • blight caused by construction of Cross-Bronx Expressway, hastened white flight
New York’s 16th Congressional District • High poverty & high percentage children (> 1/3 population under 18 in 1990) • Jonathan Kozol writes about in his book Amazing Grace: 1991 median household income=$7,600 • Revival in 1980s & 1990s • 57,000 housing units built or rehabbed
New York’s 16th Congressional District • Successful CDCs • reverse population losses, but • still uphill battle to reduce poverty
Ohio’s 10th Congressional District • Population center moving west out of the city of Cleveland--1/2 of electorate outside of city limits • city neighborhoods, working class suburbs, and newer middle-class suburbs
Ohio’s 10th Congressional District • Over 94% white • voters are socially conservative and economically liberal • Between 1970 & 1983 the Cleveland Region lost 1/4 of all of its manufacturing jobs
Ohio’s 10th Congressional District • Economic restructuring unevenly distributed across district • by 1987 poverty rate on Cleveland’s Westside is 25 percent (three times higher than the district as a whole--8%) • Population loss • Increase gang activity in suburbs
Ohio’s 10th Congressional District • Highway expansion aided migration from Parma to Strongsville & Medina • Greater voter turnout than in the South Bronx
Illinois 13th Congressional District • Affluent suburbs • major growth area • population • corporate HQs: McDonald’s, Ace Hardware, Spiegel • growth stimulated by govt. spending • roads • schools • colleges
Illinois 13th Congressional District • Naperville pop. • 7,000 in 1950 • 128,000 in 2000 • Children living in poverty (2000) • Naperville-1.1% • Chicago-33.6% • Revenues to support rapid growth come from attracting even more new growth • Overwhelming psychological force “to be a success”
The Problem of economic segregation • Place matters • housing availability • shopping • schools • community safety • voter engagement • government investment
A shrinking middle-class • Number of persons living in families making 50-200% of US median income, declined from 68% in 1979 to 61.5% in 1998. • Groups at the top (over 200% of median) and the bottom (under 50% of median) grew
Concentrating wealth • Between 1989-1998 • median wages grew by 2.4% • CEO compensation grew by 90.6% • Average CEO vs. average worker • 1978= 29:1 • 1999= 109:1
Benefits of the 1990s boom was not shared by all • Yes, there were improvements: • wages increased 6.4 percent from 1995-1999 after 15 years of stagnation • by 1997 the poverty rate began to fall (in 1999 it was 11.8 percent; the lowest since 1979) • household income grew faster in cities than suburbs • 80% of the 2.2 million households moving out of poverty in 1999 lived in cities
Benefits of the 1990s boom was not shared by all • BUT, the “average” improvements were not seen in all communities, cities, and regions • spatial mismatch • Westchester Co. NY--6th richest in nation and highest per capita homelessness in nation (1989)
Benefits of the 1990s boom was not shared by all • “Gendered job distribution:” Women more likely accept low-paying jobs to gain flexible schedules or better commuting patterns to facilitate raising children • banks gain/homeowners pay: with flight from cities/older suburbs mortgage debt increased from $1.1 to 5 trillion (1980-99)
Benefits of the 1990s boom was not shared by all • Different cities have different fiscal capacity that affect residents’ opportunities • old industrial cities (Baltimore, Cleveland, Detroit) • old industrial cities w/ more diverse economies (NYC, Chicago, Boston, San Francisco) • newer cities (LA, Seattle, San Diego, Houston)
So are there options to reduce disparities? • Implement programs on a metropolitan area-wide basis • Limit bidding wars (Federal govt. policies needed to limit city-suburb and region-region tax bidding wars) • Promote metropolitan cooperation and governance
Options for reducing inequalities • Link community development to regional economy • Strengthen public schools • Encourage job development • Expand “Earned Income Tax Credit” program • max annual benefit $3,888 for family of three earning $9,700 or less (phased out at $31,000)
Options for reducing inequalities • Raise minimum wage above poverty level • Expand health insurance and child care • Promote voting through more flexible and aggressive registration practices