Download
1 / 58
600 likes | 887 Vues
Pigeonpea Genomics Initiative. Nagendra K. Singh NRC on Plant Biotechnology Indian Agricultural Research Institute, New Delhi-110012. Status of Plant Genome Sequencing. Sequencing of 16 Plants in Progress (10 completed + 6 about to be finished)

E N D
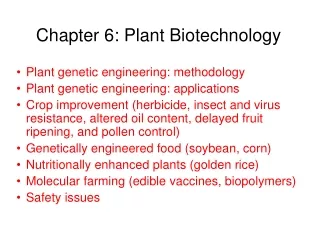
Pigeonpea Genomics Initiative Nagendra K. Singh NRC on Plant Biotechnology Indian Agricultural Research Institute, New Delhi-110012
Status of Plant Genome Sequencing • Sequencing of 16 Plants in Progress • (10 completed + 6 about to be finished) • Arabidopsis, Rice, Poplar, Medicago, Sorghum, Papaya, Cassava, Cucumber, Tomato, Potato, Maize, Soybean, Citrus, Grape, Banana, Wheat • Arabidopsis and Rice with high quality BAC by BAC sequence data
International Rice Genome Sequencing Project INDIAN INITIATIVE FOR RICE GENOME SEQUENCING
INTERNATIONAL TOMATO GENOME SEQENCING CONSORTIUM Based on Song-Bin Chang’s Ph. D. Thesis 2004
Indo-US AKI Pigeonpea Genomics Initiative from Orphan Legume to Draft Genome Sequence
Productivity (hg/ha) World-Food grains Cereals Productivity (hg/ha) Pulses Year FAOSTAT, 2010
Pigeonpea • Pigeonpea (Cajanus cajan (L.) Millsp.) belongs to family Fabaceae with chromosome no. 2n=22 and genome size of 853 Mbp • A major source of protein to about 20% of the world population (Thu et al., 2003). • An abundant source of minerals and vitamins (Saxena et al., 2002). • Most versatile food legume with diversified uses such as food, feed, fodder and fuel. • It is hardy, widely adaptable crop with better tolerance to drought and high temperature. • Plays an important role in sustaining soil productivity by fixing atmospheric nitrogen.
Area, Production and Productivity (FAOSTAT 2010) • India produces about 75% of the global output of pigeonpea. • Very low average productivity (800 kg/ha) as compared to it’s potential (2000 kg/ha) (Ali and Kumar, 2005).
Constraints to High Productivity • Growing traditional landraces on large area • Non-availability of quality seeds of improved varieties • Inferior plant type with low harvest index • Long crop duration (5-9 months) • Wilt, SMD, Water logging, Pod borer • Poor agronomic practices
Objectives: 100,000 ESTs and genic-SSR /SNP markers Genomic SSR markers Mutant lines and mapping populations as resource for gene discovery High density molecular linkage map as a reference map Markers and genes for important agronomic traits Pigeonpea genome informatics platform Sequencing gene-rich BAC clones of pigeonpea First meeting of Pigeonpea Consortium on 10th Nov 2006 at NRCPB, New Delhi
1st Draft of Pigeonpea Genome SequenceSubmitted to NCBI GenBank, July 2011
Pigeonpea Genome- Comparison with Soybean • 152 homologs of genes for abiotic stress tolerance • 56 genes for heat shock proteins (HSP), • 32 genes for glutathione-S-transferase (GST), • 28 genes for trehalose-6-phosphate synthase (TPS), • 8 genes for glutamine synthase (GS), • 7 genes for water channel protein aquaporins • several transcription factors e.g. DREB, NAC and MYB genes
Pigeonpea Genome- Comparison with Soybean Circular Map of Synteny between 11 Pigeonpea 20 Soybean Chromosomes Based on 512 Single Copy Genes
Pigeonpea Genome-Development of Genic-SSR and SNP markers by mRNA Sequencing
M 1 2 3 4 5 6 7 8 9 10 11 12 13 14 15 16 17 18 19 20 21 22 23 24 25 26 27 28 29 30 M 150bp 100bp 50bp Agarose gel (4.0 %) showing allelic variation among 30 genotypes of pigeonpea and related wild species with genic-SSR marker ASSR-277
Asha GTR 9 HDMO4-1 H2004-1 JA 4 PCMF 39-1 PCMF 40 PCMF 43-7 GT288A PS 971 PS 956 Pusa 9 Kudarat ICPA 2089A ICPR 2438 UPAS 120 TTB 7 Pusa Dwarf Bahar Maruti Pusa 992 GTR 11 R. aurea C. platycarpus(1) C. platycarpus(2) C. cajanifolius C. lineatus C. scricea R. bracteata C. albicans C. cajan cultivars Ia1 Ia I Ia2 Wild species Ib IIa II IIb Similarity coefficient Dendrogram showing phylogenetic relationship of 30 genotypes of Cajanus cajan and related wild species based on 20 genic-SSR markers
Pigeonpea Genome- High density linkage map based on 366 genic-SNP and 24 genic-SSR markers
Pigeonpea Genome- HASSR Markers M 1 2 3 4 5 6 7 8 1 2 3 4 5 6 7 8 1 2 3 4 5 6 7 8 M 1 2 3 4 5 6 7 8 1 2 3 4 5 6 7 8 1 2 3 4 5 6 7 8 HASSR-283 HASSR-284 HASSR-285 300 HASSR-128 HASSR-127 200 HASSR-129 300 200 100 100
Application of Genic SSR/SNP Markers in QTL Mapping Options for Enhancing Pigeonpea Productivity Hybrids Ideotype • Ideotype:Set of features delineating the shape, size, canopy and external structure of the plant • Plant height • Number of primary and secondary branches • Number and length of internodes • Size, shape and position of leaves and reproductive organs
Application of Genic SSR/SNP Markers in QTL Mapping Development of molecular linkage map of pigeonpea Mapping of genes/QTLs for traits involved in plant ideotype and maturity
Outline of work Pusa Dwarf/ HDM04-1 Cross F1 Marker polymorphism F2 Genotyping F2:3 Linkage map Phenotyping QTL mapping
Plant Material Mapping Population: ♀ Pusa Dwarf X ♂ HDM04-1 HDM04-1 Pusa Dwarf
Markers A. Genic-SSR • Total 927 genic SSR markers, 772 developed from 454 TSA contigs and 155 from Sanger ESTs under Indo-US AKI project were used. B. Genomic-SSR • 45 genomic SSR markers from literature ( Odeny et al., 2007, 2009) • Additional 40 SSR markers were designed from public BAC end sequence database at NCBI BatchPrimer 3 software (You et al., 2008)
C. Intron length Polymorphism (ILP) Markers A total of 60 ILP primers were designed using Medicago genome as subject species genome by ConservedPrimers 2.0 software . (http://rye.pw.usda.gov/ConservedPrimers/index.html)
D. Single Nucleotide Polymorphism Assay: • Two pools of RNA from varieties namely Asha and UPAS120 were sequenced by 454-FLX sequencing and TSA contigs were used for in silico SNP identification (Indo- US AKI project). • SNPs were identified by aligning 15,511 common large TSA contigs between the two varieties. • 1536-plex and 768-plex Illumina GoldenGate assays were designed and latter was used for genotyping of F2 population
Segregation analysis: • All markers were tested for goodness of fit by chi-square test. Linkage analysis: • Linkage analysis of segregating markers was done by Mapdisto software • (http://mapdisto.free.fr/MapDisto/) at LOD = 3 QTL analysis: • Statistical analysis of Phenotypic data was performed SPSS software version 10.0 • QTL analysis was done by QTL Network software version 2.1 (Yang et al. 2008)
M A B A B A B A B A B A B A B A B A B A B A B A B A B A B A B A B A B A B A B A B A B A B A B A B M Polymorphism survey with genic-SSR markers 1 2 3 4 5 6 7 8 9 10 11 12 13 14 15 16 17 18 19 20 21 22 23 24 100 Parental polymorphism survey with ASSR markers (1-24), 21-ASSR1486 (polymorphic) L-100bp DNA ladder, A-Pusa Dwarf, B-HDM04-1 500 400 300 200
L 1 2 3 4 5 6 7 8 9 10 11 12 13 14 15 16 17 18 19 20 21 22 P1 P2 Genotyping of F2 with SSR Markers Genotyping of F2 population with ASSR8 in 4% metaphor agarose gel L- 100bp DNA ladder, 1-22 - F2 genotypes, P1- Pusa Dwarf, P2- HDM04-1 500 300 200 100
ASSR 66 77 95 148 205 206 247 277281286300304 317 363390 L 1 2 1 2 1 2 1 2 1 2 1 2 1 2 L 1 2 1 2 1 2 1 2 1 2 1 2 1 2 1 2 Parental Polymorphism survey on PAGE 250bp Parental polymorphism survey for ASSR markers in 8% PAGE L-50bp DNA ladder, 1- Pusa Dwarf, 2-HDM04-1 200bp 150bp
Genotyping on PAGE M 1 2 3 4 5 6 7 8 9 10 11 12 13 14 15 16 17 18 19 20 21 22 P1 P2 300 200 100 Genotyping of ASSR206 on 8% polyacrylamide gels. M-100bp ladder, P1- Pusa Dwarf, P2- HDM04-1, 1-22 F2 genotypes
Phenotyping of F2 and F2:3 (20 plants/lines) Plant height Number of primary branches per plant Number of pods per plant Days to flowering Days to maturity Number of secondary branches Pod bearing length No. of seeds per pod Growth habit (determinate/indetrminate)
Frequency Distribution of Plant Height and No. of Primary Branches P2 P1 P1 P2 cm cm P2 P2 P1 P1
Frequency Distribution for No. of Pods P2 P2 P1 P1 Pod numbers Pod numbers