Download
1 / 26
260 likes | 758 Vues
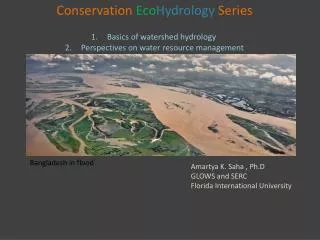
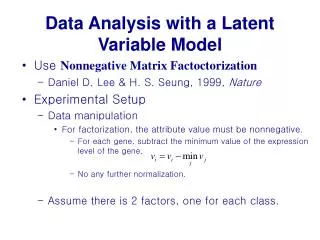
A Comparison of a SWAT model for the Cannonsville Watershed with and without Variable Source Area Hydrology. Josh Woodbury Christine A. Shoemaker Dillon Cowan Zachary Easton. Outline. SWAT2005 vs SWAT-VSA Calibration Corn analysis Conclusion Questions ?. SWAT2005 and SWAT-VSA.

E N D
A Comparison of a SWAT model for the Cannonsville Watershed with and without Variable Source Area Hydrology Josh Woodbury Christine A. Shoemaker Dillon Cowan Zachary Easton
Outline • SWAT2005 vs SWAT-VSA • Calibration • Corn analysis • Conclusion • Questions ?
SWAT2005 and SWAT-VSA • The current SWAT2005 version is a replication of the SWAT 2000 model developed by Bryan Tolson • Dillon Cowan replicated the SWAT 2000 files as closely as possible to create the current SWAT2005 version • This included creating the same number of subbasins with similar HRUs • Much time was spent insuring that the corn and pasture areas in each model are identical • Although corn is only a small percentage of the watershed, it accounts for a significant percentage of the phosphorous loading to the reservoir • Meticulous attention to corn area is important in order to create an accurate model replication • Very time consuming since the watershed delineation did not create the correct amount of corn area because of the small percentage
SWAT2005 and SWAT-VSA • Source code changes done in the 2000 version (Tolson and Shoemaker, 2007, Jn of Hydrology) were also done in the 2005 source code • Includes modifications to manure spreading, plant growth, flow in/on frozen soils, and monthly subbasin temperatures • Tolson showed that these changes produce a better model
SWAT-VSA model • The SWAT-VSA model incorporates the model and file changes in the SWAT2005 model, as well as Variable Source Area Hydrology • VSA hydrology is incorporated into the model using the same techniques used to create the Town Brook VSA model • Meticulously accounted for corn and pasture areas between the SWAT2005 and SWAT-VSA models • SWAT-VSA uses 10 different wetness classes
Why bother with VSA hydrology? • The VSA model will make different predictions concerning the spatial distribution of the nutrient transport than a non-VSA model • If we know where the runoff is coming from, we can make judgments about the best nutrient placement • Apply management practices to the model and see how this changes future predictions • We can compare the future predictions of SWAT2005 and SWAT-VSA to see if careful placement of nutrients changes nutrient loading to the reservoir
Outline SWAT2005 vs SWAT-VSA Calibration Corn analysis Conclusion Questions ?
Calibration • Both of the models are calibrated first for flow, then sediment and finally phosphorous • The calibration period is from Jan. 1994 to Dec. 1999 • Auto-calibration and manual calibration techniques are used to get the best fit • Parameters used are based upon a sensitivity analysis done by Ryan Fleming
Calibration Firstly the models are calibrated using an algorithm called DDS DDS is a simple stochastic single-solution based heuristic global search algorithm designed for automatic calibration of watershed models (Tolson and Shoemaker, WRR, 2007) DDS is used with a weighted Sum of Squared Error objective function
Calibration Once flow and sediment are calibrated, Total Dissolved Phosphorous (TDP) and Particulate Phosphorous (PP) are calibrated using DDS • Manual calibration techniques are then used to slightly improve the models
Calibration • Many different attempts where made in order to find the best way to calibrate for more than one output at a time • The problem is that the SSE values for each of the outputs vary by orders of magnitude • By simply summing all the outputs, some of the outputs are weighted more heavily than others • This problem has plagued users trying to auto-calibrate SWAT • Most papers addressing the subject suggest using some type of weighting scheme, either simple weighting factors, or complicated statistical weighting schemes
Calibration • Initially tried to calibrate for Flow, Sediment, PP and TDP at once • Tried using weighting values, taking the natural log of the data, and weighting the natural logs of the data in order to decrease the differences in magnitude • Eventually gave up on calibrating all four outputs at once and adopted the calibration method previously presented • This is still not the best way to auto-calibrate, as it still requires some manual calibration at the end
Results – Calibration Period • Calibration period: January 1994 to December 1999 • Both models do well simulating the measured data • Discrepancy in PP phosphorous results • SWAT model does better although both models do well with sediment
Results – Flow and Sediment • Flow • Calibrations are quite good, both models capture trends • Models tend to over predict high flows and under predict low flows Flow • Sediment • Models do well with average loads, but tend to under predict high loadings • Some of this error can be attributed to flow error Sediment
Results – Phosphorous • TDP • Both models do well with average loads, but tend to under predict high loads • Part of this error can be attributed to flow under prediction TDP • PP • SWAT2005 model does better than SWAT-VSA model • Interesting since PP is largely impacted by sediment, which is captured well by both models PP
Outline SWAT2005 vs SWAT-VSA Calibration Corn analysis Conclusion Questions ?
Land Use Management Analysis • Since SWAT-VSA uses a combination of land use and wetness class to determine HRUs, we can look into the impact of moving different land uses • In this analysis, we looked at the impact of moving corn to low runoff generating areas, i.e. low wetness classes
Corn Analysis - Setup • SWAT-VSA • All corn HRUs are changed to either wetness class 1 or 2 • Turned corn wetness classes of 3 – 10 into hay or pasture • In order to keep total corn area constant, some hay and pasture wetness classes 1 and 2 were turned into corn • Meticulously kept track of each wetness class area as well as land use area • SWAT2005 • All corn was turned into either hay or pasture of the same soil type • Only thing that can really be done with SWAT in terms of land use
SWAT2005 Model without Corn • Flow • % Difference = 0.23 • There is no difference because overall CN did not change • Sediment • % Difference = -33.5 • Peak sediment loads are nearly cut in half, shows the impact of corn on the sediment loading
SWAT2005 Model without Corn • TDP • % Difference = -38.4 • Shows the large impact that corn has on TDP loading • PP • % Difference = -71 • large impact on PP is due to removal of corn as a direct source as well as the decrease in sediment loading
SWAT-VSA Model Corn Analysis • Flow • % Difference = -0.07 • Does not change because overall wetness class areas do not change • Sediment • % Difference = -0.23 • Does not change because decrease in sediment loading from corn is balanced by the increase in sediment loading from hay and pasture
SWAT-VSA Model Corn Analysis • TDP • % Difference = -27.5 • substantial decrease in peak loadings shows the impact of moving corn to areas of lower runoff • PP • % Difference = -49 • Since the overall sediment loadings do not change, this change in PP is directly due to moving corn areas
Corn Analysis - conclusion • From the previous analysis, it is apparent that the location of corn areas has a significant impact on Phosphorous runoff • Analysis results make physical sense • This type of nutrient reduction would occur in the watershed if all corn is moved to low-runoff areas • Although this is a best case scenario in terms of nutrient reduction, it may not be entirely practical • Moving corn to low-runoff areas may also reduce corn yeild • Need to find some trade-off point
Outline SWAT vs SWAT-VSA Calibration Corn analysis Conclusion Questions ?
Conclusion • SWAT-VSA and SWAT 2005 Models produce similar results based on available calibration data for the large 1200 km2 Cannonsville watershed. • Flow distributions can have important implications for nutrient management • Management scenarios in SWAT-VSA can include specific nutrient placement based on flow distributions • SWAT-VSA will predict decreases in phosphorous transport when corn is placed mostly in dry areas.
Outline SWAT vs SWAT-VSA Calibration Corn analysis Conclusion Questions ?