Download

1 / 23
230 likes | 269 Vues
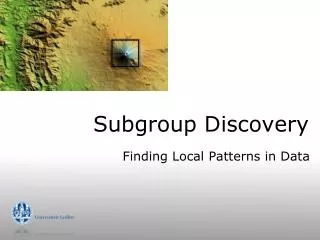
Subgroup Discovery. Finding Local Patterns in Data. Exploratory Data Analysis. Classification: model the dependence of the target on the remaining attributes. problem: sometimes classifier is a black-box, or uses only some of the available dependencies.

E N D
Subgroup Discovery Finding Local Patterns in Data
Exploratory Data Analysis • Classification: model the dependence of the target on the remaining attributes. • problem: sometimes classifier is a black-box, or uses only some of the available dependencies. • for example: in decision trees, some attributes may not appear because of overshadowing. • Exploratory Data Analysis: understanding the effects of all attributes on the target. Q: How can we use ideas from C4.5 to approach this task? A: Why not list the info gain of all attributes, and rank according to this?
Interactions between Attributes • Single-attribute effects are not enough • XOR problem is extreme example: 2 attributes with no info gain form a good subgroup • Apart from A=a, B=b, C=c, … • consider also A=aB=b, A=aC=c, …, B=bC=c, … A=aB=bC=c, … …
Subgroup Discovery Task “Find all subgroups within the inductive constraints that show a significant deviation in the distribution of the target attribute” • Inductive constraints: • Minimum support • (Maximum support) • Minimum quality (Information gain, X2, WRAcc) • Maximum complexity • …
Confusion Matrix • A confusion matrix (or contingency table) describes the frequency of the four combinations of subgroup and target: • within subgroup, positive • within subgroup, negative • outside subgroup, positive • outside subgroup, negative target subgroup
Confusion Matrix • High numbers along the TT-FF diagonal means a positivecorrelation between subgroup and target • High numbers along the TF-FT diagonal means a negative correlation between subgroup and target • Target distribution on DB is fixed • Only two degrees of freedom target subgroup
Quality Measures A quality measure for subgroups summarizes the interestingness of its confusion matrix into a single number WRAcc, weighted relative accuracy • Also known as Novelty • Balance between coverage and unexpectedness • nov(S,T) = p(ST) – p(S)p(T) • between −.25 and .25, 0 means uninteresting target nov(S,T) = p(ST)−p(S)p(T) = .42 − .297 = .123 subgroup
Quality Measures • WRAcc: Weighted Relative Accuracy • Information gain • X2 • Correlation Coefficient • Laplace • Jaccard • Specificity
A=a1 B=b1 B=b2 C=c1 … A=a2 … A=a1B=b1 A=a1B=b2 A=a1B=b1C=c1 … minimum support level reached Subgroup Discovery as Search T … A=a2B=b1
Refinements are (anti-)monotonic Refinements are (anti-) monotonic in their support… …but not in interestingness. This may go up or down. target concept S3 refinement of S2 S2 refinement of S1 subgroup S1
Produces collection of subgroups Local Patterns Subgroups may overlap and conflict Subgroup, unusual distribution of classes Produces decision-list Classifier Exclusive coverage of instance space Rules, clear conclusion SD vs. Separate & Conquer Subgroup Discovery Separate & Conquer
ROC Space ROC = Receiver Operating Characteristics Each subgroup forms a point in ROC space, in terms of its False Positive Rate, and True Positive Rate. TPR = TP/Pos = TP/TP+FN (fraction of positive cases in the subgroup) FPR = FP/Neg = FP/FP+TN (fraction of negative cases in the subgroup)
ROC Space Properties entire database ‘ROC heaven’ perfect subgroup ‘ROC hell’ random subgroup perfect negative subgroup empty subgroup minimum support threshold
Measures in ROC Space 0 source: Flach & Fürnkranz positive negative WRAcc Information Gain
Other Measures Precision Gini index Correlation coefficient Foil gain
Refinements in ROC Space Refinements of S will reduce the FPR and TPR, so will appear to the left and below S. Blue polygon represents possible refinements of S. With a convex measure, f is bounded by measure of corners. . . . If corners are not above minimum quality or current best (top k?), prune search space below S. . .
X2 Information gain Multi-class problems • Generalising to problems with more than 2 classes is fairly staightforward: target combine values to quality measure subgroup
h = 3600 h = 3100 h = 2200 Numeric Subgroup Discovery • Target is numeric: find subgroups with significantly higher or lower average value • Trade-off between size of subgroup and average target value
Quiz 1 Q: Assume you have found a subgroup with a positive WRAcc (or infoGain). Can any refinement of this subgroup be negative? A: Yes.
Quiz 2 Q: Assume both A and B are a random subgroup. Can the subgroup A B be an interesting subgroup? A: Yes. Think of the XOR problem. A B is either completely positive or negative. . . .
Quiz 3 Q: Can the combination of two positive subgroups ever produce a negative subgroup? A: Yes. .