Subgroup Discovery
Subgroup Discovery. Finding Local Patterns in Data. Exploratory Data Analysis. Scan the data without much prior focus Find unusual parts of the data Analyse attribute dependencies interpret this as ‘ rule ’ : if X =x and Y =y then Z is unusual


Subgroup Discovery
E N D
Presentation Transcript
Subgroup Discovery Finding Local Patterns in Data
Exploratory Data Analysis • Scan the data without much prior focus • Find unusual parts of the data • Analyse attribute dependencies • interpret this as ‘rule’: if X=x and Y=y then Z is unusual • Complex data: nominal, numeric, relational? the Subgroup
Exploratory Data Analysis • Classification: model the dependency of the target on the remaining attributes. • problem: sometimes classifier is a black-box, or uses only some of the available dependencies. • for example: in decision trees, some attributes may not appear because of overshadowing. • Exploratory Data Analysis: understanding the effects of all attributes on the target.
Interactions between Attributes • Single-attribute effects are not enough • XOR problem is extreme example: 2 attributes with no info gain form a good subgroup • Apart from A=a, B=b, C=c, … • consider also A=aB=b, A=aC=c, …, B=bC=c, … A=aB=bC=c, … …
Subgroup Discovery Task “Find all subgroups within the inductive constraints that show a significant deviation in the distribution of the target attributes” • Inductive constraints: • Minimum support • (Maximum support) • Minimum quality (Information gain, X2, WRAcc) • Maximum complexity • …
Confusion Matrix • A confusion matrix (or contingency table) describes the frequency of the four combinations of subgroup and target: • within subgroup, positive • within subgroup, negative • outside subgroup, positive • outside subgroup, negative target subgroup
Confusion Matrix • High numbers along the TT-FF diagonal means a positivecorrelation between subgroup and target • High numbers along the TF-FT diagonal means a negative correlation between subgroup and target • Target distribution on DB is fixed • Only two degrees of freedom target subgroup
Quality Measures A quality measure for subgroups summarizes the interestingness of its confusion matrix into a single number WRAcc, weighted relative accuracy • Balance between coverage and unexpectedness • WRAcc(S,T) = p(ST) – p(S)p(T) • between −.25 and .25, 0 means uninteresting target WRAcc(S,T) = p(ST)−p(S)p(T) = .42 − .297 = .123 subgroup
Quality Measures • WRAcc: Weighted Relative Accuracy • Information gain • X2 • Correlation Coefficient • Laplace • Jaccard • Specificity • …
A=a1 B=b1 B=b2 C=c1 … A=a2 … A=a1B=b1 A=a1B=b2 A=a1B=b1C=c1 … minimum support level reached Subgroup Discovery as Search true … A=a2B=b1
Refinements are (anti-)monotonic entire database Refinements are (anti-) monotonic in their support… …but not in interestingness. This may go up or down. target concept S3 refinement of S2 S2 refinement of S1 subgroup S1
ROC Space ROC = Receiver Operating Characteristics Each subgroup forms a point in ROC space, in terms of its False Positive Rate, and True Positive Rate. TPR = TP/Pos = TP/TP+FN (fraction of positive cases in the subgroup) FPR = FP/Neg = FP/FP+TN (fraction of negative cases in the subgroup)
ROC Space Properties entire database ‘ROC heaven’ perfect subgroup ‘ROC hell’ random subgroup perfect negative subgroup empty subgroup minimum support threshold
Measures in ROC Space 0 source: Flach & Fürnkranz positive negative WRAcc Information Gain isometric
Other Measures Precision Gini index Foil gain Correlation coefficient
Refinements in ROC Space Refinements of S will reduce the FPR and TPR, so will appear to the left and below S. Blue polygon represents possible refinements of S. With a convex measure, f is bounded by measure of corners. . . . If corners are not above minimum quality or current best (top k?), prune search space below S. . .
X2 Information gain Multi-class problems • Generalising to problems with more than 2 classes is fairly staightforward: target combine values to quality measure subgroup source: Nijssen & Kok
h = 3600 h = 3100 h = 2200 Numeric Subgroup Discovery • Target is numeric: find subgroups with significantly higher or lower average value • Trade-off between size of subgroup and average target value
Types of SD for Numeric Targets • Regression subgroup discovery • numeric target has order and scale • Ordinal subgroup discovery • numeric target has order • Ranked subgroup discovery • numeric target has order or scale
ordinal target regression target Partial ranking objects share a rank Vancouver 2010 Winter Olympics
Fractional ranks shared ranks are averaged Offical IOC ranking of countries (med > 0) Rank Country Medals Athletes Continent Popul. Language Family Repub. Polar 1 USA 37 214 N. America 309 Germanic y y 2 Germany 30 152 Europe 82 Germanic y n 3 Canada 26 205 N. America 34 Germanic n y 4 Norway 23 100 Europe 4.8 Germanic n y 5 Austria 16 79 Europe 8.3 Germanic y n 6 Russ. Fed. 15 179 Asia 142 Slavic y y 7 Korea 14 46 Asia 73 Altaic y n 9 China 11 90 Asia 1338 Sino-Tibetan y n 9 Sweden 11 107 Europe 9.3 Germanic n y 9 France 11 107 Europe 65 Italic y n 11 Switzerland 9 144 Europe 7.8 Germanic y n 12 Netherlands 8 34 Europe 16.5 Germanic n n 13.5 Czech Rep. 6 92 Europe 10.5 Slavic y n 13.5 Poland 6 50 Europe 38 Slavic y n 16 Italy 5 110 Europe 60 Italic y n 16 Japan 5 94 Asia 127 Japonic n n 16 Finland 5 95 Europe 5.3 Finno-Ugric y y 20 Australia 3 40 Australia 22 Germanic y n 20 Belarus 3 49 Europe 9.6 Slavic y n 20 Slovakia 3 73 Europe 5.4 Slavic y n 20 Croatia 3 18 Europe 4.5 Slavic y n 20 Slovenia 3 49 Europe 2 Slavic y n 23 Latvia 2 58 Europe 2.2 Slavic y n 25 Great Britain 1 52 Europe 61 Germanic n n 25 Estonia 1 30 Europe 1.3 Finno-Ugric y n 25 Kazakhstan 1 38 Asia 16 Turkic y n
Interesting Subgroups ‘polar = yes’ 1. United States 3. Canada 4. Norway 6. Russian Federation 9. Sweden 16 Finland ‘language_family = Germanic & athletes 60’ 1. United States 2. Germany 3. Canada 4. Norway 5. Austria 9. Sweden 11. Switzerland
Intuitions • Size: larger subgroups are more reliable • Rank: majority of objects appear at the top • Position: ‘middle’ of subgroup should differ from middle of ranking • Deviation: objects should have similar rank * language_family = Slavic * * * * * * *
Intuitions * * * • Size: larger subgroups are more reliable • Rank: majority of objects appear at the top • Position: ‘middle’ of subgroup should differ from middle of ranking • Deviation: objects should have similar rank * * polar = yes *
Intuitions * • Size: larger subgroups are more reliable • Rank: majority of objects appear at the top • Position: ‘middle’ of subgroup should differ from middle of ranking • Deviation: objects should have similar rank * population 10M * * * * * * * *
Intuitions • Size: larger subgroups are more reliable • Rank: majority of objects appear at the top • Position: ‘middle’ of subgroup should differ from middle of ranking • Deviation: objects should have similar rank language_family = Slavic & population 10M * * * * *
Quality Measures • Average • Mean test • z-Score • t-Statistic • Median X2 statistic • AUC of ROC • Wilcoxon-Mann-Whitney Ranks statistic • Median MAD Metric
Meet Cortana the open source Subgroup Discovery tool
Cortana Features • Generic Subgroup Discovery algorithm • quality measure • search strategy • inductive constraints • Flat file, .txt, .arff, (DB connection to come) • Support for complex targets • 41 quality measures • ROC plots • Statistical validation
Target Concepts • ‘Classical’ Subgroup Discovery • nominal targets (classification) • numeric targets (regression) • Exceptional Model Mining (to be discussed in a few slides) • multiple targets • regression, correlation • multi-label classification
Mixed Data • Data types • binary • nominal • numeric • Numeric data is treated dynamically (no discretisation as preprocessing) • all: consider all available thresholds • bins: discretise the current candidate subgroup • best: find best threshold, and search from there
Statistical Validation • Determine distribution of random results • random subsets • random conditions • swap-randomization • Determine minimum quality • Significance of individual results • Validate quality measures • how exceptional?
Open Source • You can • Use Cortana binary datamining.liacs.nl/cortana.html • Use and modify Cortana sources (Java)
Exceptional Model Mining Subgroup Discovery with multiple target attributes
Mixture of Distributions • For each datapoint it is unclear whether it belongs to G or G • Intensional description of exceptional subgroup G? • Model class unknown • Model parameters unknown
Solution: extend Subgroup Discovery • Use other information than X and Y: object desciptions D • Use Subgroup Discovery to scan sub-populations in terms of D Subgroup Discovery: find subgroups of the database where the target attribute shows an unusual distribution.
Solution: extend Subgroup Discovery • Use other information than X and Y: object desciptions D • Use Subgroup Discovery to scan sub-populations in terms of D • Model over subgroup becomes target of SD Subgroup Discovery: find subgroups of the database where the target attributes show an unusual distribution, by means of modeling over the target attributes. Exceptional Model Mining
target concept object description y X Exceptional Model Mining • Define a target concept (X and y)
target concept object description y X modeling Exceptional Model Mining • Define a target concept (X and y) • Choose a model class C • Define a quality measure φover C
target concept object description y X modeling Subgroup Discovery Exceptional Model Mining • Define a target concept (X and y) • Choose a model class C • Define a quality measure φover C • Use Subgroup Discovery to find exceptional subgroups G and associated model M
Quality Measure • Specify what defines an exceptional subgroup G based on properties of model M • Absolute measure (absolute quality of M) • Correlation coefficient • Predictive accuracy • Difference measure (difference between M and M) • Difference in slope • qualitative properties of classifier • Reliable results • Minimum support level • Statistical significance of G
Correlation Model • Correlation coefficient φρ = ρ(G) • Absolute difference in correlation φabs = |ρ(G) - ρ(G)| • Entropy weighted absolute difference φent = H(p)·|ρ(G) - ρ(G)| • Statistical significance of correlation difference φscd • compute z-score from ρ through Fisher transform • compute p-value from z-score
Regression Model • Compare slope bof yi= a + b·xi+ e, and yi= a + b·xi+ e • Compute significance of slope difference φssd drive = 1 basement = 0 #baths ≤ 1 y = 30 723 + 8.45·x y = 41 568 + 3.31·x
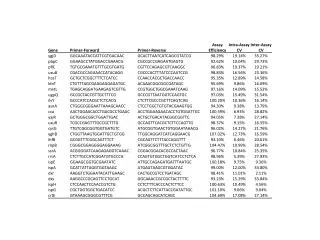
Gene Expression Data 11_band = ‘no deletion’ survival time ≤ 1919 XP_498569.1 ≤ 57 y = 3313 - 1.77·x y = 360 + 0.40·x
Classification Model • Decision Table Majority classifier • BDeu measure (predictiveness) • Hellinger (unusual distribution) whole database RIF1 160.45 prognosis = ‘unknown’