Coastal Geomorphology Lab: Erosion and Landform Change Analysis
240 likes | 380 Vues
This laboratory activity focuses on analyzing coastal geomorphological changes through various tasks. Participants will calculate erosion rates along the Suffolk coastline using ground surveys, investigate coastal landslides through aerial photography by comparing data from 1976 and 1995, and analyze historical maps to assess long-term cliff retreat. Additionally, students will explore human impacts on beach environments, particularly in California, and examine changes driven by major storms. This activity aims to deepen understanding of coastal processes and their implications.

Coastal Geomorphology Lab: Erosion and Landform Change Analysis
E N D
Presentation Transcript
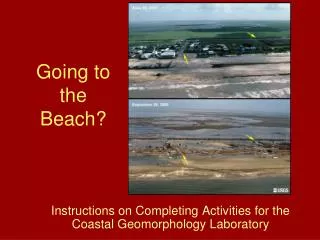
Going to the Beach? Instructions on Completing Activities for the Coastal Geomorphology Laboratory
Task 1: Calculate erosion along the Suffolk coastline in the U.K. using ground survey
SUBMISSION IS ADVANCING AT A FRIGHTFUL SPEED 1 meter per flag
Task 1: Calculate erosion along the Suffolk coastline in the U.K. using ground survey • Finish table • Calculate erosion rates
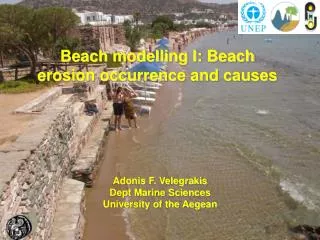
Task 2. Analyze change in a coastal landslide using aerial photography Looking east
Task 2. Analyze change in a coastal landslide using aerial photography Bluff (small cliff) retreat from landsliding: how fast? how much?
Task 2. Analyze change in a coastal landslide using aerial photography
Task 2. Analyze change in a coastal landslide using aerial photography Analyze 1976 and 1995 and then answer: how much farmland has been lost (sq. meters) and how fast? • Download these files from the web page version of the assignment • Print ’76
Task 2. Analyze change in a coastal landslide using aerial photography Analyze 1976 and 1995 and then answer: how much farmland has been lost (sq. meters) and how fast? • Print ’76 • Color lost farmland • Make 10 m grid • Count up lost area • Measure biggest distance lost & calculate rate of retreat
Task 3. Analyze change at Point Reyes using a historical map
Activity 1: Task 5 Calculating very long-term rates of cliff retreat using offshore rocks and sea stacks ~6000 YbpPretty close to today… Approx. last major glacial event Sea level change curves
Activity 1: Task 5 Calculating very long-term rates of cliff retreat using offshore rocks and sea stacks (10 points)
Activity 1: Task 5 Calculating very long-term rates of cliff retreat using offshore rocks and sea stacks
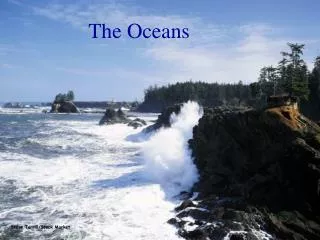
Overview of Activity 2 You study change in depositional (beach) contexts, using a mixture of maps, aerial photography, and satellite images.
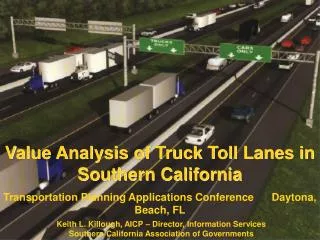
Activity 2 • Task 1. Analyze human modification of California beach: Humboldt Bay • Task 2. Analyze change accomplished by major storms • Study the effect of Hurricanes on the Dauphin Island (a barrier island)
Task 1. Analyze human modification of California beaches You analyze Humboldt Bay
Task 1. Analyze human modification of California beaches You analyze Humboldt Bay… add Jetties