Download
1 / 21
210 likes | 356 Vues
TERM - 2008 Transport at a crossroads. Dr. Peder Jensen Project Manager, Transport and Environment. PCPs T ransport. ENV. TREN. Organisational set-up and outputs. Country information. Network of national experts Indicator fact sheets Indicators data sheets. Statistics. EEA.

E N D
TERM - 2008 Transport at a crossroads Dr. Peder JensenProject Manager, Transport and Environment
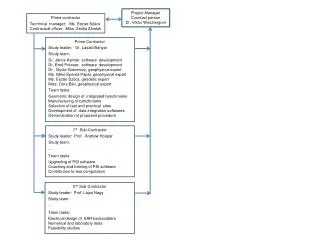
PCPs Transport ENV TREN Organisational set-up and outputs Country information • Network of national experts • Indicator fact sheets • Indicators data sheets Statistics EEA Policy context Indicators Reports Review TERM consist of: • Country fact sheets • Indicator based reports • Technical/focus studies
Danmark fossilfrit i 2050... også transport sektoren Total Jævn aftrapning Raporterede emissioner Index Vækst som hidtil Transport
Greenhouse Gas Emissions – growth due to transport growth Transport sector GHG emissions increased by 28% over the period of 1990 -2006 in EEA countries
Greenhouse gas emissions • Austria, Malta and Slovakia were the only states that saw a decrease in transport GHG emission compared between 2005 and 2006 • Since the mid 1990s transport and emission growth in the new EU MSs have been greater than in the old EU MSs
Climate Change and Transport – much is needed but too little is happening • Between 1990 and 2006 CO2 emissions from the transport sector increased by 27% in EU • Had transport sector emissions followed the same reduction trend as in society as a whole, total EU-27 GHG during the period 1990–2005 would have fallen by 14% instead of 7.9%. 7.9% 27% 1990 - 2006
Freight transport - growing faster than the economy • Transport volume growth follows growth in GDP • No clear signs of decoupling of transport volume from economic growth • EU-15 MSs show increase in freight intensity
Freight transport -road transport dominates the inland market • Road transport has a 77% market share • Road transport share has grown at the expense of rail and inland waterway transport • In the EU-10 road transport's share reached 65% in 2005 at the expense of rail transport
Passenger Transport – continuous growth • Growth has occurred for all modes with the exception of sea transport • Growth has been slower on average than growth in the economy since the mid 1990s
Passenger Transport – car ownership increase • In 2005, the average car ownership level reached 460 cars per 1000 inhabitants • Liechtenstein has the highest of 705 per 1000 inhabitants. The largest growth was observed in the new MSs and Turkey • In Lithuania car ownership has more than doubled in 10 years from 198 to 428 cars per 1000 inhabitants in 2005
Transport Air Pollutant Emissions Between 1990 and 2006 total transport emissions of particulates, acidifying substances and ozone precursors decreased by 31% and 47% respectively
Air emissionsAnnual average mean NO2 and PM10 concentrations Concentration of NO2 (2010 limit) and PM10 (2005 limit) are at or above the European air quality limits
Effekten af biobrændstof og elbiler i Danmark Fortsat vækst Biobrændstof - 10% 2020, 50% CO2 effekt Elbiler - salg 25% af nye biler efter 5 år
Transport fuels The real (inflation-corrected) average price of road fuel in the EU has only increased slightly during recent decade Fuel prices fluctuated dramatically during the last year.
The need for demand management Freight Demand is growing fastest for modes of transport that emit higher CO2 levels
The need for demand management Leisure, work and shopping appear to be the main drivers of travel in Europe
The need for demand management Measures such as congestion charging can promote the use of other modes such as cycling. Since the introduction of congestion charging in London in 2003 cycling levels have increased.
Konklusion • Teknologien kan give et bidrag til emissions reduktion men kan ikke stå alene • Bedre udnyttelse af flåden kan give vigtige bidrag • Efterspørgselsstyring en nødt til at være en del af pakken