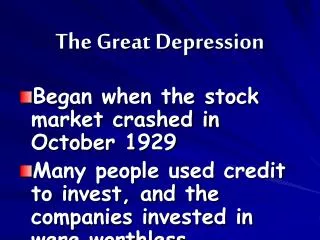
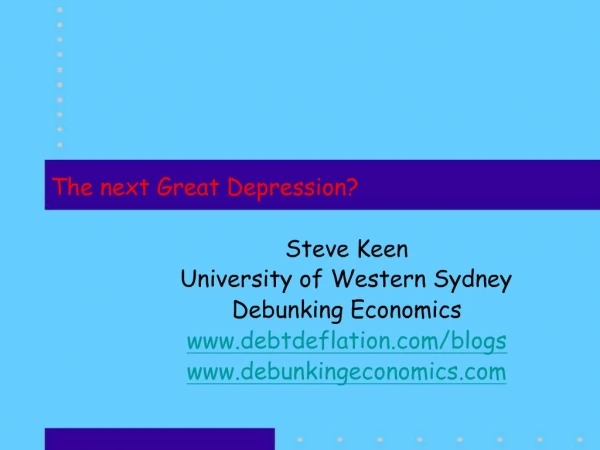
The next Great Depression
The Scale: Biggest Bubbles in History. The Scale: Greatest Debt Level in History. 1890s Depression. 1930s Depression. Let'szoom inhere. The Scale: Greatest Debt Level in History. But Australia's different, right?.... Our

The next Great Depression
E N D
Presentation Transcript
1. The next Great Depression? Steve Keen
University of Western Sydney
Debunking Economics
www.debtdeflation.com/blogs
www.debunkingeconomics.com
2. The Scale: Biggest Bubbles in History
3. The Scale: Greatest Debt Level in History
4. The Scale: Greatest Debt Level in History But Australia�s different, right?...
5. The Ponzi Economy 72-74 & 84-92: debt-induced boom, bust, & recovery�
6. Back in the USA� Deleveraging-driven downturn�
7. Why hasn�t it happened here? Give it time�
8. Did (neoclassical) economists see this coming? �the current economic situation is in many ways better than what we have experienced in years�
Our central forecast remains indeed quite benign:
a soft landing in the United States,
a strong and sustained recovery in Europe,
a solid trajectory in Japan
and buoyant activity in China and India.
In line with recent trends, sustained growth in OECD economies would be underpinned by strong job creation and falling unemployment.� (p. 9)
OECD Chief Economist Jean-Philippe Cotis
in OECD Economic Outlook June 2007
Why so ignorant?
Static modelling (equilibrium-assuming �dynamics�)
Ignore role of credit & debt
9. Minsky�s �Financial Instability Hypothesis� A rival, time-&-debt-aware model:
Economy in historical time (both ignored by conventional �neoclassical� economics)
Debt-induced recession in recent past
Firms and banks conservative re debt/equity, assets
Only conservative projects are funded
Recovery means most projects succeed
Firms and banks revise risk premiums
Accepted debt/equity ratio rises
Assets revalued upwards�
�Stability is destabilising�
Period of tranquility causes expectations to rise�
10. The Euphoric Economy Self-fulfilling expectations
Decline in risk aversion causes increase in investment
Investment expansion causes economy to grow faster
Asset prices rise
speculation on assets profitable
Increased willingness to lend increases money supply
Money supply endogenous money, not under RBA control
Riskier investments enabled, asset speculation rises
The emergence of �Ponzi� (Bond, Skase�) financiers
Cash flow less than debt servicing costs
Profit by selling assets on rising market
Interest-rate insensitive demand for finance
11. The Assets Boom and Bust Eventually:
Rising rates make conservative projects speculative
Non-Ponzi investors sell assets to service debts
Entry of new sellers floods asset markets
Rising trend of asset prices falters or reverses
Ponzi financiers go bankrupt:
Can no longer sell assets for a profit
Debt servicing on assets far exceeds cash flows
Asset prices collapse, increasing debt/equity ratios
Endogenous expansion of money supply reverses
Investment evaporates; economic growth slows
Economy enters a debt-induced recession
Back where we started...
12. Crisis and Aftermath Modelling Minsky
Extension of Goodwin�s Growth Cycle to include debt
4 �stylised facts�
Wages share grows if wage rises exceed productivity
Employment rises if growth exceeds productivity + population increase
Bank lend money to finance investment & speculation
Speculation rises when growth rises
Dynamics
Borrow money to finance investment during a boom
Repay some of it during a slump
Debt/ Income ratio rises in series of booms/busts
Eventually one boom where debt accumulation passes �point of no return��
13. Better dynamic, credit-aware model� Minsky�s �Financial Instability Hypothesis� more realistic�
14. Can Ben Bernanke (and others) �Do It�? Previous model without a government sector�
In real world, huge stimulus packages undertaken:
�On the fiscal front, governments from the world�s largest 20 economies are expected to collectively pump about $US5 trillion into their economies by the end of next year
(or nearly 8 per cent of global GDP since the crisis began).
Altogether, the measures are the equivalent of an extraordinary and unprecedented 18 per cent of global GDP.� (Kevin Rudd)
Plus �quantitative easing� in the US & UK:
15. Can Ben Bernanke (and others) �Do It�? �If we do fall into deflation, however, we can take comfort that the logic of the printing press example must assert itself, and sufficient injections of money will ultimately always reverse a deflation.� (Bernanke 2002)
16. Can Ben Bernanke (and others) �Do It�? But money supply is expanding by less than increase in Money Base:
17. Can Ben Bernanke (and others) �Do It�? What�s going wrong with the money �printing press�?
�Money multiplier� (ratio broad money measures to Base Money) collapsing as Bernanke expands Base�
18. Another interpretation: limitless lending Who�s in control of the money supply and debt?
Economics textbooks
The Government/Central Bank
Central Bank creates �base money�
Sets �money multiplier�
Credit Money = Base Money / Money Multiplier
Economic data
�There is no evidence that either the monetary base � leads the cycle, although some economists still believe this monetary myth.
� the monetary base lags the cycle slightly�
The difference of M2-M1 leads the cycle by � about three quarters.� (Kydland & Prescott 1990, p. 15)
19. �Money from nothing, but your cheques ain�t free� Loan an asset of bank
Simultaneously creates liability of money in firm�s deposit account:
20. �Money from nothing, but your cheques ain�t free� Full system (see �Roving Cavaliers of Credit� blog post) is:
21. �Money from nothing, but your cheques ain�t free� �Credit Crunch�:
Economic downturn caused by change in credit alone
Debt-deleveraging not an issue here�
22. What about a Government Rescue? Yes, But� Which gives more �bang for buck��rescuing bankers or debtors?
23. What about a Government Rescue? Yes, But� Rescue would work if only problem was �credit crunch�
Stimulus �papers over pothole�
Credit flows again, economy returns to steady growth
But debt-saturation as well?
Deleveraging looms�no-one else left to lend to:
24. What about the Market? Yes, But� An impressive rally�
25. What about the Market? Yes, But� An impressive rally�
26. What about the Market? Yes, But� An impressive rally� in 1930 too�
27. What about the Market? Yes, But� An impressive rally� in 1930 too�
28. What about the Market? Yes, But� Until it ran out of steam�
29. What About the Recovery? Yes, But� Turnaround in unemployment?...
30. What About the Recovery? Yes, But� Not a shallow recession�
31. What About the Recovery? Yes, But� Barry Eichengreen & Kevin H. O�Rourke, �A Tale of Two Depressions�: http://www.voxeu.org/index.php?q=node/3421
32. Prognosis & Remedies? Deleveraging-induced downturn inevitable
Demand=Sum of GDP plus change in debt
Falling debt reduces demand
All post-WWII recoveries involved rising debt
Deleveraging outweighs government stimulus
E.g. 1st Rudd stimulus A$42bn (4% GDP)
Aggregate private debt A$2 trillion
5% deleveraging�A$100 billion cut in demand
Can�t solve debt-induced crisis with more debt
But that�s what�s been happening�
As it did in Japan 1990-2009�
Public debt from 50%-200%
Keeping �zombie banks� alive
33. Deleveraging and economic activity� What impact could deleveraging have?
34. Deleveraging and economic activity� What about the USA?
Higher debt level means further to fall�
35. Alternative policies Across-the-board debt reduction
Irresponsible lending caused the crisis
Abolish large fraction of debt
Guarantee bank deposits at same time
A 21st Century Jubilee�
Redefine capital assets to reduce Ponzi behaviour
Time-limited Shares (like bonds)
House valuation on imputed rent
Maximum secured mortgage debt say 10 times annual rental
Remove positive feedback between leverage and house prices
Or we�ll be here again in 2070�
36. For Further Reading� www.debtdeflation.com/blogs